Renewable Energy and Electricity
- There is widespread popular support for using renewable energy, particularly solar and wind energy, which provide electricity without giving rise to any carbon dioxide emissions.
- Harnessing these for electricity depends on the cost and efficiency of the technology, which is constantly improving, thus reducing costs per peak kilowatt, and per kWh at the source.
- Utilising electricity from solar and wind in a grid becomes problematical at high levels for complex but now well-demonstrated reasons. Supply does not correspond with demand.
- Back-up generating capacity is required due to the intermittent nature of solar and wind. System costs escalate with increasing proportion of variable renewables.
- Policy settings to support renewables are generally required to confer priority in grid systems and also subsidize them, and some 50 countries have these provisions.
- Utilising solar and wind-generated electricity in a stand-alone system requires corresponding battery or other storage capacity.
- The possibility of large-scale use of hydrogen in the future as a transport fuel increases the potential for both renewables directly and base-load electricity supply off-peak.
Technology to utilize the forces of nature for doing work to supply human needs is as old as the first sailing ship. But attention swung away from renewable sources as the industrial revolution progressed on the basis of the concentrated energy locked up in fossil fuels. This was compounded by the increasing use of reticulated electricity based on fossil fuels and the importance of portable high-density energy sources for transport – the era of oil.
As electricity demand escalated, with supply depending largely on fossil fuels plus some hydro power and then nuclear energy, concerns arose about carbon dioxide (CO2) emissions contributing to possible global warming. Attention again turned to the huge sources of energy surging around us in nature – sun, wind, and seas in particular. There was never any doubt about the magnitude of these, the challenge was always in harnessing them so as to meet demand for reliable and affordable electricity.
Today many countries are well advanced in meeting that challenge, while also testing the practical limits of doing so from wind and solar (variable renewable energy, VRE). The relatively dilute nature of wind and solar mean that harnessing them is very materials-intensive – many times that from energy-dense sources.
Wind turbines have developed greatly in recent decades, solar photovoltaic technology is much more efficient, and there are improved prospects of harnessing the energy in tides and waves. Solar thermal technologies in particular (with some heat storage) have great potential in sunny climates. With government encouragement to utilize wind and solar technologies, their costs have come down and are now in the same league per kilowatt-hour dispatched from the plant as the costs of fossil fuel technologies, especially where there are carbon emissions charges on electricity generation from them.
The World Energy Outlook 2016 (WEO2016) made the points that VRE have five technical properties that make them distinct from more traditional forms of power generation. First, their maximum output fluctuates according to the real-time availability of wind and sunlight. Second, such fluctuations can be predicted accurately only a few hours to days in advance. Third, they are non-synchronous and use devices known as power converters in order to connect to the grid (this can be relevant in terms of how to ensure the stability of power systems). Fourth, they are more modular and can be deployed in a much more distributed fashion. Fifth, unlike fossil or nuclear fuels, wind and sunlight cannot be transported, and while renewable energy resources are available in many areas, the best resources are frequently located at a distance from load centres thus, in some cases, increasing connection costs.
These points are more fully put forward and modelled in the 2019 OECD Nuclear Energy Agency (NEA) publication, The Costs of Decarbonization: System Costs with High Shares of Nuclear and Renewables. All the modelling is within a 50g CO2 per kWh emission constraint, and quantifies the system costs due to different levels of VRE input, despite declining LCOE costs (and zero marginal costs) for those. The concept of system effects, which are heavily driven by the attributes of VRE listed above, has been conceptualized and explored extensively by both the OECD International Energy Agency (IEA) and the NEA along with research from academia, industry and governments. System effects are often divided into the following four broadly defined categories:
- Profile costs (also referred to as utilization costs or backup costs by some researchers).
- Balancing costs.
- Grid costs.
- Connection costs to the grid (sometimes included in LCOE).
The 2019 NEA study states: "Profile costs (or utilization costs) refer to the increase in the generation cost of the overall electricity system in response to the variablity of VRE output. They are thus at the heart of the notion of system effects. They capture, in particular, the fact that in most of the cases it is more expensive to provide the residual load in a system with VRE than in an equivalent system where VRE are replaced by dispatchable plants."
High levels of VRE require significant enhancement of system integration measures. These measures include flexible power sources such as hydro and open cycle gas turbines, demand-side measures, electricity storage, strong and smart transmission and distribution grids. The costs of all these, over and above the generation costs, comprise the system costs. Grid-level system costs for VRE where they replace dispatchable sources are large ($15-80/MWh) but depend on country, context and technology (onshore wind < offshore wind < solar PV). (See later section on System integration costs of intermittent renewable power generation.)
A further aspect of considering sources such as wind and solar in the context of grid supply is that their true capacity is discounted to allow for intermittency. In the UK this is by a factor of 0.43 for wind and 0.17 for solar PV, hence declared net capacity (DNC) is the figure used in national reporting – “the nominal maximum capability of a generating set to supply electricity to consumers.” It has a considerable effect on published load and capacity factors. This novel convention is not followed in this information paper.
Demand for clean energy
There is a fundamental attractiveness about harnessing such forces in an age which is very conscious of the environmental effects of burning fossil fuels, and where sustainability is an ethical norm. So today the focus is on both adequacy of energy supply long-term and also the environmental implications of particular sources. In that regard, the costs being imposed on CO2 emissions in developed countries at least have profoundly changed the economic outlook of clean energy sources.
A market-determined carbon price creates incentives for energy sources that are cleaner than current fossil fuel sources without distinguishing among different technologies. This puts the onus on the generating utility to employ technologies which efficiently supply power to the consumer at a competitive price. Wind, solar and nuclear are the main contenders.
Sun, wind, waves, rivers, tides and the heat from radioactive decay in the earth's mantle as well as biomass are all abundant and ongoing, hence the term "renewables". Only one, the power of falling water in rivers, has been significantly tapped for electricity for many years, though utilization of wind is increasing rapidly and it is now acknowledged as a mainstream energy source – accounting for nearly 5% of electricity generation worldwide in 2018. Solar energy's main human application has been in agriculture and forestry, via photosynthesis, and increasingly it is harnessed for heat. Until recently electricity has been a niche application for solar. Biomass (e.g. sugar cane residue) is burned where it can be utilized, but there are serious questions regarding wider usage. The others are little used as yet.
Turning to the use of abundant renewable energy sources other than large-scale hydro for electricity, there are challenges in actually harnessing them. Apart from solar photovoltaic (PV) systems which produce electricity directly, the question is how to make them turn dynamos to generate the electricity. If it is heat which is harnessed, this is via a steam generating system.
If the fundamental opportunity of these renewables is their abundance and relatively widespread occurrence, the fundamental challenge, especially for electricity supply, is applying them to meet demand given their variable and diffuse nature*. This means either that there must be reliable duplicate sources of electricity beyond the normal system reserve, or some means of large-scale electricity storage (see later section).
* The main exception is geothermal, which is not widely accessible.
Policies which favour renewables over other sources may also be required. Such policies, now in place in about 50 countries, include priority dispatch for electricity from renewable sources and special feed-in tariffs, quota obligations and energy tax exemptions.
In 2015 over 140 countries submitted to the UN’s Framework Convention on Climate Change (UNFCCC) secretariat their Intended Nationally Determined Contributions (INDCs) to combat climate change. Together, these would lead to an 8% per capita reduction in CO2 emissions by 2025 and 9% by 2030. The role of India and China INDCs is noteworthy here. Regarding solar capacity, India pledged 246 GWe and China 352 GWe by 2030 on top of present world 178 GWe. Regarding wind, China pledged 345 GWe and India 78 GWe capacity by 2030 on top of 2015 world capacity.
The prospects, opportunities and challenges for renewables are discussed below in this context.
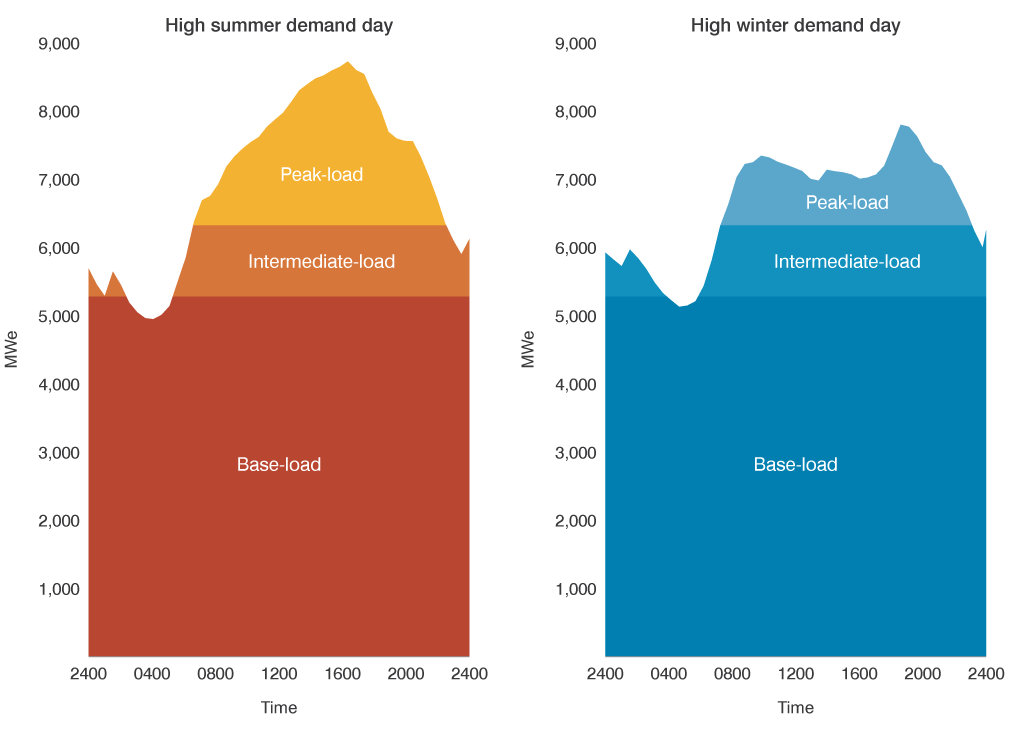
Load curves for typical electricity grid (source: VENcorp)
This load curve diagram shows that much of the electricity demand is in fact for continuous supply (base-load), while some is for a lesser amount of predictable supply for about three-quarters of the day, and less still for variable peak demand up to half of the time; some of the overnight demand is for domestic hot water systems on cheap tariffs. With overnight charging of electric vehicles it is easy to see how the base-load proportion would grow, increasing the scope for nuclear and other plants which produce it. Source: Vencorp
Most electricity demand is for continuous, reliable supply that has traditionally been provided by base-load electricity generation. Some is for shorter-term (e.g. peak-load) requirements on a broadly predictable daily and weekly basis. Hence if renewable sources are linked to a grid, the question of back-up capacity arises; for a stand-alone system, energy storage is the main issue. Apart from pumped-storage hydro systems (see later section), no such means exist at present on any large scale.
However, a distinct advantage of solar and to some extent other renewable systems is that they are distributed and may be near the points of demand, thereby reducing power transmission losses if traditional generating plants are distant. Of course, this same feature more often counts against wind in that the best sites for harnessing it are sometimes remote from populations, and the main back-up for lack of wind in one place is wind blowing hard in another, hence requiring a wide network with flexible operation.
At the end of 2020 there was 733 GWe of installed wind capacity (95% onshore), 708 GWe of installed solar PV capacity and 6.5 GWe of solar thermal worldwide accoring to the International Renewable Energy Agency (IRENA).
Rivers and hydroelectricity
Hydroelectric power, using the potential energy of rivers, is by far the best-established means of electricity generation from renewable sources. It may also be large-scale – nine of the ten largest power plants in the world are hydro, using dams on rivers. China’s Three Gorges leads with 22.5 GWe, then Itaipu in Brazil with 14 GWe and Xiluodu in China, 13.9 GWe. In contrast to wind and solar generation, hydro plants have considerable mechanical inertia and are synchronous, helping with grid stability.
In 2018 some 63% of all renewable electricity was from hydro, which supplied about 4149 TWh from 1175 GWe (IRENA figures). Based on these figures, this would indicate a capacity factor of 36%, although the International Renewable Energy Agency (IRENA) reported global weighted average capacity factors of 47% for hydropower in 2017.
Hydropower supplies over 17% of world electricity (>95% in Norway, 57% in Canada, 60% in Switzerland, 57% in New Zealand, 40% in Sweden, 8% in the USA, 6% in Australia). Half of hydro capacity is in five nations: China (340 GWe), USA (84 GWe), Brazil (109 GWe), Canada (81 GWe), and Russia (54 GWe). Apart from those five countries with a relative abundance of it (Norway, Canada, Switzerland, New Zealand and Sweden), hydro capacity is normally applied to peak-load demand, because it is so readily stopped and started. The individual turbines of a hydro plant can be run up from zero to full power in about ten minutes. This also means that it is an ideal complement to wind power in a grid system, and is used thus most effectively by Denmark (see case study below).
Hydropower using large storage reservoirs on rivers is not a major option for the future in the developed countries because most major sites in these countries having potential for harnessing gravity in this way are either being exploited already or are unavailable for other reasons such as environmental considerations. Growth to 2030 is expected mostly in China and Latin America. China has commissioned the $26 billion Three Gorges dam, which produces 22.5 GWe and has a major role in flood control, but it has displaced over 1.2 million people. Brazil is planning to have 25 GWe of new hydro capacity by 2025, involving considerable environmental impact.
The chief advantage of hydro systems is their capacity to handle seasonal (as well as daily) high peak loads. In practice the utilization of stored water is sometimes complicated by demands for irrigation which may occur out of phase with peak electrical demands.
Hydroelectric power plants can constrain the water flow through each turbine to vary output, though with fixed-blade turbines this reduces generating efficiency. More sophisticated and expensive Kaplan turbines have variable pitch and are efficient at a range of flow rates. With multiple fixed-blade turbines (e.g. Francis turbine), they can individually be run at full power or shut down.
Run-of-river hydro systems are usually much smaller than dammed ones but have potentially wider application. Some short-term pondage can help them adapt to daily load profiles, but generally they produce continuously, apart from seasonal variation in river flows. Most of Nepal’s hydro capacity is run-of-river, which diminishes with low flow in winter. Small-scale hydro plants under 10 MWe represent about 12% of world capacity, and most of these are run-of-river ones. In IRENA statistics, ‘small hydropower’ is under 1 MWe, and totals 31 MWe worldwide, while ‘medium hydropower’ (1-10 MWe) totals 115 MWe.
Pumped storage is discussed below under Renewables in relation to base-load demand.
Wind energy
Utilization of wind energy has increased spectacularly in recent years, with annual increases in installed capacity of around 10% to 2019, with tens of thousands of turbines installed. However, all this has to be backed up with dispatchable generating capacity, due to low (20-30%) utilization and intermittency (see later sections on this aspect). The global average LCOE of onshore wind was about $80/MWh in 2015 – very competitive on a unit MWh basis but cannot be compared with dispatchable MWh due to the unreliability. In the 'Stated Policies' scenario of the International Energy Agency's (IEA's) World Energy Outlook 2019, some 1856 GWe of wind capacity would be operational in 2040, producing 5226 TWh, and in the 'Sustainable Development' scenario, there would be 2930 GWe producing 8295 TWh (i.e. assumed capacity factors of about 32%).
IRENA statistics show 699 GWe onshore and 34 GWe offshore installed in 2020, up from 564 GWe in 2018 when 1263 TWh was produced. Nearly 90% of the world offshore total is in Europe.
Harnessing power from wind (or any fluid in open flow) is subject to Betz’s law, which says that no turbine can capture more than 59.5% of the kinetic energy in the wind (or water). Utility-scale wind turbines today achieve at peak flow up to 80% of the Betz limit.
Wind turbines of up to 6 MWe are now functioning in many countries. A prototype 8 MWe unit built by Siemens Gamesa with a 167-metre rotor diameter was commissioned in Denmark early in 2017. The average size of new turbines installed in 2017 was 5.9 MW, a 23% increase on 2016. GE is investing over $400 million in a 12 MWe offshore wind turbine which it claims will be capable of 60%-plus capacity factors in the North Sea. The turbine will be 260 metres tall from base to blade tip with a rotor diameter of 220 metres.
The power output is a function of the cube of the wind speed, so doubling the wind speed gives eight times the energy potential. In operation such turbines require a wind in the range 4 to 25 metres per second (14-90 km/h), with the maximum output being at 12-25 m/s (the excess energy being spilled above 25 m/s). While relatively few areas have significant prevailing winds in this range, many have enough to be harnessed effectively and to give better than a 25% capacity utilization. Larger ones are on taller pylons and tend to have higher capacity factors.
Where there is an economic back-up which can be called upon at very short notice (e.g. hydro), a significant proportion of electricity can be provided from wind. Depending on site, most turbines operate at about 25% load factor over the course of a year (European average), but some reach 40% offshore. There is a distinct difference between onshore and offshore sites, though the latter are more expensive to set up and run. For the UK, in 2015, onshore wind averaged 30% capacity, and offshore 41%.
.jpg")
Green Rigg wind farm in the UK (Image: EDF Energy)
In Germany, with high dependence on wind, there is corresponding high uncertainty of supply. Winter load factors averaged about 25% over 2013-17, and ranged from 12% to 35%, both figures monthly. Summer monthly load factors averaged only 14% however. Annual capacity factors were 17-20% over 2014-16. Daily average wind load factors have ranged from 2% to 68%.
Potentially the world’s largest wind farm is that planned by Forewind, a consortium of four major energy companies, for the Dogger Bank in the North Sea, costing some £30 billion. Stage 1 is 2.4 GWe, followed by 4.8 GWe, to give 7.2 GWe, which Forewind says will supply some 25 billion kWh/yr to the UK grid at projected 40% annual capacity factor. In the USA, the $8 billion, 3 GWe Anschutz Corp plant in Wyoming is planned to send power 1200 km via Utah and Nevada to the Californian grid near Las Vegas.
In 2016 the Dutch government auctioned the first development rights for the Borssele offshore wind farm, for a record low price – €72.70 per MWh – to Dong Energy plus about €14/MWh connection fee. It is auctioning 700 MWe per year to 2020.
China General Nuclear Corporation (CGN) has built a 38-turbine, 152 MWe wind farm offshore in Jiangsu province, which it expects to produce 400 GWh per year from 2017 – 30% capacity factor.
With increased scale and numbers of units, generation costs and levelized cost of energy (LCOE) is now often competitive with coal and nuclear, without allowing for backup capacity and grid connection complexities which affect their value in a system. Wind is intermittent, and when it does not blow, backup capacity such as hydro or quick-start gas is needed. When it does blow, and displaces power from other sources, it may reduce the profitability of those sources and may increase delivered prices. With any significant input from intermittent renewables sources, system cost (not the LCOE) to meet actual demand becomes the relevant metric.
One approach to mitigate intermittency is to make hydrogen by electrolysis and feed this into the gas grid, the power-to-gas strategy. It has been suggested that all electricity from wind might be used thus, greatly simplifying electrical grid management. Uniper has a 2 MW pilot plant to produce up to 360 m3/hr of hydrogen at Falkenhagen, Germany, to feed into the Ontras gas grid, which can function with 5% hydrogen. Vattenfall at Prenzlau in Germany is also experimenting with hydrogen production and storage from wind power via electrolysis. Also in Germany, near Neubrandenburg in the northeast, WIND-projekt is using surplus electricity from a 140 MWe wind farm to make hydrogen, storing it, and then burning it in a CHP unit to make electricity when demand is high. However, there is an 84% loss in this RH2-WKA (renewable hydrogen - Werder, Kessin, Altentreptow) demonstration process. Germany’s biggest operating power-to-gas plant is a 6 MW unit at Energiepark Mainz. RWE and Siemens plan a 105 MW power-to-gas pilot project, GET H2, at Lingen, using wind power, and two other similar projects are planned: Element Eins and Hybridge. In the Netherlands, Gasunie plans a 20 MW unit. BNetzA forecasts a 3 GW potential for power-to-gas by 2030.
Wind turbines have a high steel tower to mount the generator nacelle, and typically have rotors with three blades. Foundations require a substantial mass of reinforced concrete. Hence the energy inputs to manufacture are not insignificant. Also siting is important in getting a net gain from them. In the UK the Carbon Trust found that small wind turbines on houses in urban areas often caused more carbon emissions in their construction and fitting than they saved in electrical output (CT 7/8/08).
Bird kills, especially of raptor species, are an environmental impact of wind farms. In the USA half a million birds are killed each year, including 83,000 raptors (hawks, eagles, falcons etc.) according to reports of a peer-reviewed published estimate in Wildlife Society Bulletin. A similar estimate comes from the US Fish & Wildlife Service. According to Environment Canada, wind turbines kill approximately 8.2 birds per turbine per year.1 There is particular concern regarding birds covered by the US Migratory Bird Treaty Act and the Bald and Golden Eagle Protection Act, which make bird fatalities illegal. Migratory bats are also killed in large numbers.
New wind farms are increasingly offshore, in shallow seas. The UK had 7500 MWe wind capacity offshore at the end of 2017, over two-thirds of the world's total. The London Array, 20 km offshore Kent, has 175 turbines of 3.6 MWe, total 630 MWe, on a 245 km2 site and claims to be the world's largest offshore wind farm.
Replacing old turbines is becoming an issue – repowering the wind capacity. Approximately half of European capacity will be retired by 2030, and needs to be replaced mostly with larger turbines, likely without subsidies. The repowering priority is at the best sites. Full decommissioning involves removal of old towers and foundations, not simply turbines. According to lobby group WindEurope, some 22 GWe of wind turbines over 20 years old in Europe will be decommissioned by 2023, and 40 GWe by 2027. At least one-fifth of these will involve full decommissioning.
A Renewable Energy Foundation study in 2012 showed that the performance of onshore wind turbines in the UK and Denmark declined significantly with age, and offshore Danish ones declined more. A 2013 review of the data suggested that the decline might be 2% per year.
Solar energy
Solar energy is readily harnessed for low temperature heat, and in many places domestic hot water units (with storage) routinely utilize it. It is also used simply by sensible design of buildings and in many ways that are taken for granted. Industrially, probably the main use is in solar salt production – some 1000 PJ per year in Australia alone (equivalent to two-thirds of the nation's oil use). It is increasingly used in utility-scale plants, mostly photovoltaic (PV). Domestic-scale PV is widespread.
IRENA statistics show 714 GWe solar capacity (of which 707.5 GWe solar PV and 6.5 GWe solar thermal) in 2020, up from 489 GWe in 2018 when 562 TWh was produced, so average capacity factor in 2018 of 13%.
Three methods of converting the Sun's radiant energy to electricity are the focus of attention.
Photovoltaic (PV) systems
The best-known method utilizes light, ideally sunlight, acting on photovoltaic cells to produce electricity. Flat plate versions of these can readily be mounted on buildings without any aesthetic intrusion or requiring special support structures. Solar photovoltaic (PV) has for some years had application for certain signaling and communication equipment, such as remote area telecommunications equipment in Australia or simply where mains connection is inconvenient. Sales of solar PV modules are increasing strongly as their efficiency increases and price falls, coupled with financial subsidies and incentives. Harnessing power from incident sunlight is subject to the Shockley-Queisser limit giving maximum conversion of photons into electrons of about 33%. Commercial PV cells today range up to 26% conversion.
Small-scale solar PV installations for domestic or onsite industrial use are commonly 'behind the meter', and may feed surplus power into the grid. Many large-scale solar PV power plants in Europe and the USA, and now China are set up to supply electricity grids.
In recent years there has been high investment in solar PV, due to favourable subsidies and incentives. In 2019 there was 580 GWe installed worldwide according to the International Renewable Energy Agency (IRENA), up from 483 GWe in 2018, 384 GWe in 2017, and 291 GWe in 2016 – a doubling of capacity in three years. Of the total installed solar PV capacity in 2019, China accounted for 205 GWe (35% of world total), Japan 62 GWe (11%), USA 61 GWe, Germany 49 GWe, India 35 GWe, and Italy 21 GWe.
More efficiency can be gained using concentrating solar PV (CPV), where some kind of parabolic mirror tracks the sun and increases the intensity of the solar radiation up to 1000-fold. Modules are typically 35-50 kW.
In the USA Boeing has licensed its XR700 high-concentration PV (HCPV) technology to Stirling Energy Systems with a view to commercializing it for plants under 50 MWe from 2012. The HCPV cells in 2009 achieved a world record for terrestrial concentrator solar cell efficiency, at 41.6%. CPV can also be used with heliostat configuration, with a tower among a field of mirrors.
In 2011 several Californian plants planned for solar thermal changed plans to solar PV – see mention of Blythe, Imperial Valley and Calico below.
China's 200 MWe Golmud solar park was commissioned in 2011 and is claimed to produce 317 GWh/yr (18% capacity factor). The Longyangxia Dam solar park on the eastern Tibetan Plateau in China has grown to 850 MWe and claims 20% capacity factor.
In 2020 China commissioned a 2.2 GWe solar PV farm covering 27 km2 near Xining in Qinghai province. Storage capacity of 203 MWh is claimed.
India’s 214 MWe Gujarat Solar Park was commissioned in 2012 and aims for eventual 1000 MWe capacity. Adani’s 648 MWe Kamuthi solar PV plant in Tamil Nadu was completed in September 2016. The Indian government announced the 4 GWe Sambhar project in Rajasthan in 2013, expected to produce 6.4 TWh/yr, i.e. capacity factor of 18% from almost 80 km2 – however, following opposition from several environmental groups, the project has not proceeded. The 2.245 GWe Bhadla solar park in Jodhpur district of Rajasthan, covering 57 km2, became the world's largest solar park on its completion in March 2020.
The 100 MWe Perovo solar park in Ukraine was commissioned in 2011 also, with 15% capacity factor claimed. EdF has built the 115 MWe Toul-Rosieres thin-film PV plant in eastern France. There is a 97 MWe Sarnia plant in Canada. In Italy, SunEdison plans to build a 72 MWe solar PV plant near Rovigo, for $342 million.
In Australia the 102 MWe Nyngan solar PV array cost A$440 million and is designed to produce 230 GWh/yr from 2015, i.e. 26% capacity factor.
In the USA, the 550 MWe Desert Sunlight solar farm in the Mojave Desert opened early in 2015, using cadmium telluride thin film technology and financed with a $1.46 billion federal loan guarantee. MidAmerican’s Antelope Valley plants in California comprise a 579 MWe development with Sunpower as EPC contractor and due to be complete at the end of 2015. Its panels will track the sun, giving 25% more power. MidAmerican Solar owns the 550 MWe Topaz Solar Farms in San Luis Obispo County, Calif., and has a 49% interest in the 290 MWe Agua Caliente thin-film PV project commissioned in 2014 by First Solar in Yuma County, Arizona. Many PV plants are over 20 MWe, and quoted capacity factors range from 11% to 27%.
A South Korean consortium has commissioned 42 MWe PV capacity at two plants in Bulgaria, which are expected to produce 61 GWh/yr (16.5% capacity factor), their cost being €154 million (€3667/kW). Research continues into ways to make the actual solar collecting cells less expensive and more efficient. In some systems there is provision for feeding surplus PV power from domestic systems into the grid as contra to normal supply from it, which enhances the economics. The 2000 MWe Ordos thin-film solar PV plant is planned in Inner Mongolia, China, with four phases – 30, 100, 870, 1000 MWe – to be complete in 2020. Over 30 others planned are over 100 MWe, most in India, China, USA and Australia. A 230 MWe solar PV plant is planned at Setouchi in Japan, with GE taking a major stake in the JPY 80 billion project expected on line in 2018. Serbia plans a 1 GWe solar PV project costing €1.3 billion which is expected to deliver 1.15 TWh/yr to Enerxia Energy from 2015, a 13% capacity factor, without any feed-in tariff. (That output at €50/MWh would return €57.5 million pa. After €20 million pa maintenance, it is less than 3% pa return on capital.)
In Nigeria, the federal government and Delta state have set up a $5 billion public-private partnership with SkyPower FAS Energy to build 3 GWe of utility-scale solar PV capacity, with the first units coming on line in 2015. A feed-in tariff regime will support this.
A serious grid integration problem with solar PV is that cloud cover can reduce output by 70% in the space of one minute. Various battery and other means are being developed to slow this to 10% per minute, which is more manageable. The particular battery system required is designed specifically to control the rate of ramp up and ramp down. System life is ten years, compared with twice that for most renewable sources.
The manufacturing and recycling of PV modules raises a number of questions regarding both scarce commodities, and health and environmental issues. Copper indium gallium selenide (CIGS) solar cells are a particular concern, both for manufacturing and recycling. Silicon-based PV modules require high energy input in manufacture, though the silicon itself is abundant.
The International Renewable Energy Agency (IRENA) in 2020 estimated that there would be about 8 million tonnes of solar PV waste by 2030, and that the total could reach 78 million tonnes by 2050. Recycling solar PV panels is generally not economic, and there is concern about cadmium leaching from discarded panels. Some recycling is undertaken.
Solar thermal systems, concentrating solar power (CSP)
Solar thermal systems need sunlight rather than the more diffuse light which can be harnessed by solar PV. They are not viable in high latitudes. A solar thermal power plant has a system of mirrors to concentrate the sunlight on to an absorber, the energy then being used to drive steam turbines – concentrating solar thermal power (CSP). Many systems have some heat storage capacity in molten salt to enable generation after sundown, and possibly overnight.
In 2019 there was about 6.3 GWe of CSP capacity worldwide, according to IRENA, 2.3 GWe (37%) of this in Spain, 1.8 GWe (28%) in the USA, 0.5 GWe in Morocco, and 0.5 GWe in South Africa. World capacity was 5.0 GWe at the end of 2017, when 11.5 TWh was produced (i.e. 26% capacity factor).
The concentrator may be a parabolic mirror trough oriented north-south, which tracks the sun's path through the day. The absorber is located at the focal point and converts the solar radiation to heat in a fluid such as synthetic oil, which may reach 700°C. The fluid transfers heat to a secondary circuit producing steam to drive a conventional turbine and generator. Several such installations in modules of up to 80 MW are now operating. Each module requires about 50 hectares of land and needs very precise engineering and control. These plants are supplemented by a gas-fired boiler which generates about a quarter of the overall power output and keeps them warm overnight, especially if molten salt heat storage is used, as in many CSP power tower plants.
A simpler CSP concept is the linear Fresnel collector using rows of long narrow flat (or slightly curved) mirrors tracking the sun and reflecting on to one or more fixed linear receivers positioned above them. The receivers may generate steam directly.
In mid-2007 Nevada Solar One, a 64 MWe capacity solar thermal energy plant, started up. The plant was projected to produce 124 GWh per year and covers about 160 hectares with 760 mirrored troughs that concentrate the heat from the desert sun onto pipes that contain a heat transfer fluid. This is heated to 390°C and then produces steam to drive turbines. Nine similar units totaling 354 MWe have been operating in California as the Solar Energy Generating Systems. More than twenty Spanish 50 MWe parabolic trough units including Andasol 1-3, Alvarado 1, Extresol 1-2, Ibersol and Solnova 1-3, Palma del Rio 1-2, Manchasol 1-2, Valle 1-2, commenced operation in 2008-11. Andasol, Manchasol and Valle have 7.5-hour heat storage.
Other US CSP parabolic trough projects include Abengoa's Solana in Arizona, a 280 MWe project with six-hour molten salt storage enabling power generation in the evening. It has a 778 ha solar field and started operation in 2013. The $2 billion cost is offset by a $1.45 billion loan guarantee from the US Department of Energy. Abengoa's 280 MWe Mojave Solar Project near Barstow in California also uses parabolic troughs in a 715 ha solar field and came online in 2014. It has no heat storage. It has a $1.2 billion federal loan guarantee.
In 2010 California approved construction of the $6 billion, 968 MWe Blythe CSP plant by Solar Trust, the US arm of Solar Millennium at Riverside, Calif., using parabolic trough technology in four 250 MWe units occupying 28.4 sq km and funded partly by US Dept of Energy. The company has a $2.1 billion loan guarantee and a 20-year power purchase agreement with SC Edison, from 2013. However, this became a solar PV project, apparently due to difficulty in raising finance.
Another form of this CSP is the power tower, with a set of flat mirrors (heliostats) which track the sun and focus heat on the top of a tower, heating water to make steam, or molten salt to 1000°C and using this both to store the heat and produce steam for a turbine. California's Solar One/Two plant produced 10 MWe for a few years. Abengoa’s Solucar complex in Spain has the 11 MWe PS10 power tower plant with 624 mirrors, each 120 m2 and the 20 MWe PS20 adjacent, with 1255 mirrors, producing steam directly in the tower. Solucar also has three parabolic trough plants of 50 MW each. Power production in the evening can be extended fairly readily using gas combustion for heat.
The US Department of Energy awarded a $1.37 billion loan guarantee to BrightSource Energy to build the 392 MWe Ivanpah Solar Power complex in the Mojave Desert of California, essentially a gas-fired plant with major subsidized solar supplement. It comprises three CSP Luz power towers which simply heat water to 550°C to make steam, using 300,000 heliostat mirrors in pairs each of 14 m2 per MWe, in operation from 2013 as the world's largest CSP plant. The steam cycle uses air-cooled condensers. There is a back-up gas turbine, and natural gas is used to pre-heat water in the towers. It was expected to generate 940 GWh/yr, but in 2014 it reached 419 GWh, in 2015, 653 GWh and in 2016, 703 GWh (EIA data). It burned 915 TJ of gas in 2014, 1313 TJ in 2015 and 1361 TJ in 2016 (EIA data) which resulted in 46,000 tonnes of CO2 emissions in 2014, 66,000 t in 2015 and 68,000 t in 2016. On its own in 2016 this gas would produce 189 GWh of electricity (at 50% thermal efficiency), so it appears to be 27% gas-fired rather than solar in 2016. The plant is owned by BrightSource, NRG Energy and Google. BrightSource estimates that annual bird kill is about 3500 from incineration, federal biologists have higher estimates – the plant is on a migratory route. BrightSource plans a similar 500 MWe plant nearby in the Coachella Valley.
BrightSource Energy is partnering with General Electric and NOY Infrastructure & Energy Investment Fund to build the 121 MWe Ashalim Plot B Solar Thermal Power Station in Israel’s Negev desert. It was commissioned in 2019 and uses BrightSource’s CSP tower with more than 50,000 computer-controlled heliostats tracking the Sun on two axes and reflecting sunlight onto a boiler on top of a 260-metre tower. It claims to produce 320 GWh/yr. Another 121 MWe Ashalim plant developed by Negev Energy uses parabolic troughs and was also commissioned in 2019. Further phases of the project will involve solar PV.
Using molten salt in the CSP system as the transfer fluid which also stores heat, enables operation into the evening, thus approximating to much of the daily load demand profile. Torresol's 20 MWe Gemasolar (formerly Solar Tres) plant in Spain has 2650 mirrors/heliostats, each 110 m2 and molten sodium and potassium nitrate salt heat transfer (at up to 565°C) and heat storage, with steam Rankine cycle generation. It is claimed to be the world's first "near base-load” CSP plant, with 63% capacity factor claimed, but relies on natural gas to keep the salts molten, needing 15% of thermal capacity for that. Its cost was €244 million, or $144,000/kW and it is paid EUR 27 c/kWh.
The salt used may be 60% sodium nitrate, 40% potassium nitrate with melting point 220°C. Spain's 150 MWe Andasol plant stores heat at 400°C and requires 75 t of salt per MW of heat. It also uses diphenol oxide or oil for heat transfer and molten salt for heat storage. Its condensers require 5 L/kWh for cooling. Spain's Gemasolar employs 6250 tonnes of salt for both heat transfer and storage. California's 280 MWe Solana uses 125,000 tonnes of salt, kept at 277°C.
SolarReserve’s 110 MWe Crescent Dunes plant at Tonopah in Nevada has a 195-metre power tower and claimed molten salt heat storage to enable 10 hours at full load, and 500 GWh per year output (52% capacity factor). The $1 billion facility was backed by $737 million in federal loan guarantees and was owned and operated by California-based SolarReserve. After a salt leak shut it down for eight months to mid-2017, then the plant closed down in April 2019 due to its high costs and low (20%) efficiency. SolarReserve filed for bankruptcy in 2019.
SolarReserve started building the Likana 390 MWe plant in Chile but was unable to complete it and sold the project to the Cerro Dominador Group/EIG partnership in 2019. The project is to comprise three 130 MWe solar thermal towers using molten salt for heat transport and energy storage, each with 13 hours of full-load energy storage, delivering 390 MWe of continuous output, resulting in over 2800 GWh generated annually (82% capacity factor). In Chile SolarReserve was also planning to build the similar 450 MWe Tamarugal CSP plant with salt storage claimed to deliver 2600 GWh/yr (66% capacity factor). The company said it “set a new benchmark for base-load solar pricing by bidding $63/MWh, without subsidies, in Chile’s most recent auction for energy supply.” Tamarugal was unable to get contracts, so was aborted.
An 810 MWe plant occupying 13 km2 with six power towers is being built in Qinghai province in northwest China, by BrightSource with Shanghai Electric Group. It will have heat storage using molten salt. Phase 1 of this Qinghai Delingha Solar Thermal Power Project is two 135 MWe CSP plants using BrightSource power towers with up to 3.5 hours of heat storage and producing 628 GWh/yr, hence 26.55% capacity factor. Majority ownership is by Huanghe. The project will apply to NDRC for feed-in tariff. It is part of an international collaboration.
In Morocco the 510 MWe Noor-Ouarzazate CSP plant is the world’s largest CSP project. Its first 160 MWe phase, Noor 1, was commissioned early in 2016 and contracted to supply power at $0.19/kWh. It and Noor 2 of 200 MWe commissioned in 2018 use parabolic trough collectors heating diphenyl oxide or oil which produces steam in a secondary circuit, and molten salt storage enables generation beyond sunset. Noor 3 of 150 MWe commissioned in 2019 uses a 250 m high central tower with 600 MWt receiver and molten salt for heat transfer and storage. It has 7400 heliostats and is based on the 20 MWe Gemasolar plant in Spain. Noor 4 comprises 70 MWe in solar PV and is part of the $2.5 billion complex. The whole complex is reported to use 2.5 to 3 billion litres of water per year for cleaning. The areas occupied are 480, 680, 750 and 210 ha respectively so the full plant covers 21 km2.
A small portable CSP unit – the Wilson Solar Grill – uses a Fresnel lens to heat lithium nitrate to 230°C so that it can cook food after dark.
Another CSP set-up is the Solar Dish Stirling System which uses parabolic reflectors to concentrate heat to drive a Stirling cycle engine generating electricity. A Tessera Solar plant uses 25 kWe solar dishes which track the Sun and focus the energy on the power conversion unit's receiver tubes containing hydrogen gas which powers a Stirling engine. Solar heat pressurizes the hydrogen to power the four-cylinder reciprocating Solar Stirling Engine and drive a generator. The hydrogen working fluid is cooled in a closed cycle. Waste heat from the engine is transferred to the ambient air via a water-filled radiator system. The stirling cycle system is as yet unproven in these large applications, however.
A Tessera Solar plant of 709 MWe was planned at Imperial Valley in California and approved in 2010, but a year later AES Solar decided to build the plant as solar PV, and the first phase of 266 MWe was commissioned in 2014 as Mount Signal Solar. It produces 537 GWh/yr, hence 23% capacity factor.
With solar input being both diffuse* and interrupted by night and by cloud cover, solar electric generation has a low capacity factor, typically less than 15%, though this is partly addressed by heat storage using molten salt. Power costs are two to three times that of conventional sources, which puts it within reach of being economically viable where carbon emissions from fossil fuels are priced.
* In low to middle latitudes on a sunny day up to 1 kW/m2 falls on a surface maintained at right angles to the sun's rays. In Europe much less than this is received through much of the year, for instance in winter most of Europe averages less than 1 kWh/m2 per day (on a horizontal surface).
Large CSP schemes in North Africa, supplemented by heat storage, are proposed for supplying Europe via high voltage DC links. One proposal is the TuNur project based in Tunisia and supplying up to 2000 MWe via HVDC cable to Italy. A related and more ambitious one was Desertec, with estimated cost of €400 billion, networking the EU, Middle East and North Africa (MENA) with 20 transmission lines of 5 GW each, to provide 15% of Europe's electricity and much of that in MENA by 2050. The Desertec Foundation was set up in 2009 as an NGO to promote the Desertec concept.
The Desertec Industrial Initiative GmbH (Dii) “Desertenergy” is a Europe-based consortium founded in 2009 to advance the grand vision and work towards creation of a market for desert power in EU and MENA. It comprised 55 companies and institutions and is active in Morocco, Algeria and Tunisia. The first Dii-fostered project was to be the Noor-Ouarzazate 580 MWe CSP plant in Morocco (see above). Morocco is the only African country to have a transmission link to Europe. In mid-2013 the Desertec Foundation left the Dii consortium. Bosch and Siemens had left it in 2012. The Desertec Industrial Initiative then announced that it would focus on consulting after most of its former backers pulled out in 2014. The remaining members of the Munich-based consortium are Saudi company ACWA Power, German utility RWE and Chinese grid operator SGCC. The new network “Supporters of Desert Energy” became operational early in 2015 in Dubai to “identify practical hurdles for projects and offer solutions in interaction with the public sector and the civil society.”
The Mediterranean Solar Plan (MSP) targeted the development of 20 GWe of renewables by 2020, of which 5 GWe could be exported to Europe. Total investment would be of the order of €60 billion. The OECD IEA's World Energy Outlook 2010 says: The quality of its solar resource and its large uninhabited areas make the Middle East and North Africa region ideal for large-scale development of concentrating solar power, costing 10 to 13.5 ¢/kWh ... in 2035. Solar power could be exported to Europe (at transmission costs of 2 to 5 ¢/kWh) and/or to countries in sub-Saharan Africa. The report projects that the actual CSP generation cost in North Africa could be the same as EU wholesale electricity price in 2035 – about 10 ¢/kWh. In 2016 its project preparation initiative was being funded by the EU.
Both Dii and MSP appear to be moribund.
In 2021 UK-based Xlinks announced plans to build 7 GW of solar PV capacity and 3.5 GW of wind near Tantan in Morocco, with 5 GW/20 GWh storage, linking this to Wales and Devon in the UK by a 3.6 GW HVDC submarine cable of 3800 km. It would provide about 7% of UK electricity. Total project cost is about $22 billion, half being for the HVDC link.
CSP boost to fossil fuel power, hybrid systems
Solar energy producing steam can be used to boost conventional steam-cycle power stations. Australia's Kogan Creek Solar Boost Project was to be the largest solar integration with a coal-fired power station in the world. A 30-hectare field of Areva Solar's compact linear Fresnel reflectors at the existing Kogan Creek power station would produce steam fed to the modern supercritical 750 MWe coal-fired unit, helping to drive the intermediate pressure turbine, displacing heat from coal. The solar boost at 44 MW (peak sunshine) would add 44 million kWh annually, about 0.75% of output, for $105 million – equivalent to $19,000/kW of base-load capacity. After difficulties and delays, the project was aborted in 2016. The 2000 MWe Liddell coal-fired power station has a 2 MWe equivalent solar boost (9 MW thermal addition).
In the USA the federal government has a SunShot initiative to integrate CSP with fossil fuel power plants as hybrid systems. Some $20 million is offered for two to four projects. The US Department of Energy says that 11 to 21 GWe of CSP could effectively be integrated into existing fossil fuel plants, utilizing the turbines and transmission infrastructure.
While CSP is well behind solar PV as its prices continue to fall and utilities become more familiar with PV. However, CSP can provide thermal storage and thus be dispatchable and it can provide low-cost steam for existing power plants (hybrid set up). Also, CSP has the potential to provide heating and cooling for industrial processes and desalination.
Solar updraft tower
Another kind of solar thermal plant is the solar updraft tower, using a huge chimney surrounded at its base by a solar collector zone like an open greenhouse. The air under this skirt is heated and rises up the chimney, turning turbines as it does so. The 50 MWe Buronga plant planned in Australia was to be a prototype, but Enviromission's initial plans are now for two 200 MWe versions each using 32 turbines of 6.25 MWe with a 10 square kilometre collector zone under a 730 metre high tower in the Arizona desert. Thermal mass – possibly brine ponds – under the collector zone means that some operation will continue into the night. A 50 kWe prototype plant of this design operated in Spain 1982-89. In China the 27.5 MWe Jinshawan solar updraft tower is under construction.
Direct heating
A significant role of solar energy is that of direct heating. Much of our energy need is for heat below 60oC, eg. in hot water systems. A lot more, particularly in industry, is for heat in the range 60-110oC. Together these may account for a significant proportion of primary energy use in industrialized nations. The first need can readily be supplied by solar power much of the time in some places, and the second application commercially is probably not far off. Such uses will diminish to some extent both the demand for electricity and the consumption of fossil fuels, particularly if coupled with energy conservation measures such as insulation.
With adequate insulation, heat pumps utilising the conventional refrigeration cycle can be used to warm and cool buildings, with very little energy input other than from the sun. Eventually, up to ten percent of total primary energy in industrialized countries may be supplied by direct solar thermal techniques, and to some extent this will substitute for base-load electrical energy.
Geothermal energy
The core of the Earth is very hot, and temperature in its crust generally rises 2.5 to 3.5°C with each 100 metres depth simply due to that core heat. The source of this heat is partly residual, from the Earth’s formation some 4.5 billion years ago, and partly due to the radioactive decay of naturally-occurring radioisotopes in the mantle. See also information paper on The Cosmic Origins of Uranium.
Where hot underground steam can be tapped and brought to the surface it may be used to generate electricity. Such geothermal sources have potential in certain parts of the world such as New Zealand, USA, Mexico, Indonesia, the Philippines and Italy. Geothermal energy is attractive because it is low-cost to run and is dispatchable, unlike wind and solar.
Global installed capacity was about 14 GWe in 2020, up from 13 GWe in 2018 when it produced 88 TWh (IRENA data) – i.e. 77% capacity factor in 2017. Capacity includes 2.6 GWe (18% of the world total) in the USA (mostly in California), 2.1 GWe (15%) in Indonesia, 1.9 GWe (14%) in the Philippines, 1.5 GWe (11%) in Turkey, 1.0 GWe (7%) in New Zealand, 0.9 GWe (7%) in Mexico, 0.8 GWe in Kenya and 0.8 GWe in Italy. Iceland gets one-quarter of its electricity from around 750 MWe of geothermal plant. Lihir Gold mine in Papua New Guinea has 56 MWe installed, the last 20 MWe costing $40 million – about the same as the annual savings from the expanded plant. Europe has more than 100 geothermal power plants with about 1.6 GWe installed in 2017, producing about 12.0 TWh. The largest geothermal plant is The Geysers in California, which currently operates at an average capacity of 725 MWe, but this is diminishing. See also Geothermal Energy Association website.
The Iceland Deep Drilling Project (IDDP) launched in 2000 aims to investigate the economic feasibility of extracting energy and chemicals from fluids under supercritical conditions, with much higher energy content. The project’s initial targets were achieved early in 2017, starting from an existing 2,500 m deep production well at the Reykjanes Peninsula geothermal field in the southwest of the country. Drilling reached a depth of 4,659 metres and encountered fluids at supercritical conditions. The measured temperature was 427°C and the pressure 34 MPa. Potential utilization is being assessed.
There are also prospects in certain other areas for hot fractured rock geothermal, or hot dry rock geothermal – pumping water underground to regions of the Earth's crust which are very hot or using hot brine from these regions. The heat – up to about 250°C – is due to high levels of radioactivity in the granites and because they are insulated at 4-5 km depth. They typically have 15-40 ppm uranium and/or thorium, but may be ten times this. The heat from radiogenic decay* is used to make steam for electricity generation. South Australia has some very prospective areas. The main problem with this technology is producing and maintaining the artificially-fractured rock as the heat exchanger. Only one such project is operational, the Geox 3 MWe plant at Landau, Germany, using hot water (160ºC) pumped up from 3.3 km down (and maybe should be classed as conventional geothermal). It cost €20 million. A 50 MWe Australian plant was envisaged as having 9 deep wells – 4 down and 5 up but the Habanero project closed down in 2016 after pilot operation at 1 MWe over 160 days showed it was not viable.
* For geodynamics: 11 milliwatts per tonne (range 3-100 mW/t) in granite.
Ground source heat pump systems or engineered geothermal systems also come into this category, though the temperatures are much lower and utilization is for space heating rather than electricity. Generally the cost of construction and installation is prohibitive for the amount of energy extracted. The UK has a city-centre geothermal heat network in Southampton where water at 75°C is abstracted from a deep saline aquifer at a depth of 1.8 km. Customers for the heat include the local hospital, university and commercial premises. The 1997 Geoscience Australia building in Canberra is heated and cooled thus, using a system of 210 pumps throughout the building which carry water through loops of pipe buried in 352 boreholes each 100 metres deep in the ground. Here the temperature is a steady 17°C, so that it is used as a heat sink or heat source at different times of the year. See 10-year report (pdf).
The Global Geothermal Alliance aims to achieve a 500% increase in the global installed capacity for power generation along with a 200% increase in geothermal heating by 2030. Abandoned deep mines provide potential access to the Earth’s core heat.
Ocean energy
This falls into three categories – tidal, wave and temperature gradient, described separately below. Collectively they are receiving more attention, especially in the EU, where some €3 billion of mostly private money has been invested. The European Commission's Strategic Energy Technology (SET) plan acknowledges the potential role of ocean energy in Europe's future energy mix and suggests enhancing regional cooperation in the Atlantic region. The EU Ocean Energy Forum was to develop a roadmap by 2020. In 2019 it claimed: “100 GWe of ocean energy can be installed in Europe to meet 10% of demand” by 2050.
Tidal energy – barriers, tidal range
Harnessing the tides with a barrage in a bay or estuary has been achieved in France (240 MWe in the Rance Estuary, since 1966), Canada (20 MWe at Annapolis in the Bay of Fundy, since 1984), South Korea (Sihwa, 260 MWe, since 2011), and Russia (White Sea, 0.5 MWe), and could be achieved in certain other areas where there is a large tidal range. The trapped water can be used to turn turbines as it is released through the tidal barrage in either direction. The Severn barrage proposed in the UK in the 1970s would have 7 GWe capacity and 40% capacity factor, so nuclear options were much less expensive. Worldwide this technology appears to have little potential, largely due to environmental constraints.
The Swansea Bay Tidal Lagoon pathfinder project in Wales was a 320 MWe tidal barrier expected to generate over 530 GWh per year (19% capacity factor) and costing £1.3 billion. It was expected to start construction in 2018 but is now unlikely to proceed. Natural Energy Wyre in the UK has set up a consortium to develop the Eco-THEP, a 90 MW tidal barrage plant with six turbines on the River Wyre near Fleetwood in northwest England by 2020. It predicts an annual output of 220 GWh – a 28% capacity factor. The planned Cardiff Tidal Lagoon involves a 20 km breakwater with 108 turbines in at least two powerhouse units, total 2171 MWe, producing 5500 GWh per year at low cost. About 600 million m3 of water would pass through the turbines on each tidal cycle. An application to build the project was expected in 2019.
Tidal energy – tidal stream
Placing free-standing turbines in major coastal tidal streams appears to have greater potential than barriers, and this is being developed. Tidal barrier capacity installed in Europe since 2010 reached 27 MWe in 2018, with 12 MWe of that still operational. The remainder had been decommissioned following the end of testing programmes. Production from tidal streams in 2018 was 34 GWh. Another 8 MWe of capacity is planned for 2019.
Currents are predictable and those with velocities of 2 to 3 metres per second are ideal and the kinetic energy involved is equivalent to a very high wind speed. This means that a 1 MWe tidal turbine rotor is less than 20 m diameter, compared with 60 m for a 1 MWe wind turbine. Units can be packed more densely than wind turbines in a wind farm, and positioned far enough below the surface to avoid storm damage.
A 300 kW turbine with 11 m diameter rotor in the Bristol Channel can be jacked out of the water for maintenance. Based on this prototype, early in 2008 the 1.2 MWe SeaGen twin turbine was installed in Strangford Lough, Northern Ireland, billed as the first commercial grid-connected tidal stream turbine. It produced power 18-20 hours per day and was operated by a Siemens subsidiary until it was closed in 2019 after producing 11.6 GWh. The next project is a 10.5 MWe nine-turbine array off the coast of Anglesey.
The MeyGen 398 MWe tidal turbine project is in Pentland Firth, between Orkney and the Scottish mainland, and the initial 6 MWe demonstration array of six turbines uses Atlantis* and Andritz technology. The first 1.5 MWe turbine came online in November 2016 and phase 1 had exported 17 GWh to the grid by mid-2019. Meygen phase 1B is known as Project Stroma and uses two 2 MWe Atlantis AR2000 turbines. Phase 1C will use 49 turbines, total 73.5 MWe. The first Atlantis 1MWe prototype was deployed at the European Marine Energy Centre at Orkney in 2011, and a 1 MWe Andritz Hydro Hammerfest prototype is also deployed there, as is a 2 MWe turbine from Scotrenewables mounted under a barge – the SR2000. At the North Shetland tidal array in Bluemull Sound, Nova Innovation is installing three 100 kW turbines, the first already supplying power to the grid.
* Atlantis Resources owns 92% of Tidal Power Scotland Ltd, which owns 83.5% of MeyGen Ltd. In December 2017 GFC Alliance agreed to buy 49.99% of Atlantis Resources.
At the European Marine Energy Centre in Orkney, Orbital Marine Power's 2 MWe O2 floating tidal turbine was installed in mid-2021 and secured with anchors.
In France, two pilot 1 MWe tidal turbines were commissioned by EDF off the Brittany coast at the end of 2015. They are 16 m diameter to pilot the technology with a view to the installation of seven 2 MWe tidal turbines in the Raz Blanchard tidal race off Normandy in 2018. However, the company involved, OpenHydro, failed and was liquidated.
French energy company Engie has announced plans to build a tidal energy project on the western coast of the Cotentin peninsula in northwest France. It aims to install four tidal turbines with a total generating capacity of 5.6 MWe by 2018 in a region with the strongest marine currents in Europe.
Some tidal stream generators are designed to oscillate, using the tidal flow to move hydroplanes connected to hydraulic arms sideways or up and down. A prototype has been installed off the coast of Portugal.
Another experimental design is using a shroud to speed up the flow through a venturus in which the turbine is placed. This has been trialled in Australia and British Colombia.
A major pilot project using three kinds of tidal stream turbines is being installed in the Bay of Fundy's Minas Passage, about three kilometers from shore. Some 3 MWe would be fed to the Canadian grid from the pilot project. Eventually 100 MWe is envisaged. The three designs are a 10m diameter turbine from Ireland, a Canadian Clean Current turbine and an Underwater Electric Kite from the USA. In 2018 the Irish OpenHydro turbine failed and was written off and the company went into liquidation after its parent, Naval Energies, declined further support.
Tidal power comes closest of all the intermittent renewable sources to being able to provide a continuous and predictable output, and is projected to increase from 1 billion kWh in 2002 to 35 billion in 2030 (including wave power).
Ocean Energy Europe reported 10.4 MWe deployed by the end of 2019, with 3.4 MWe more being built.
Wave energy
Harnessing power from wave motion has the potential to yield significant electricity. The potential of this is mostly between 30° and 60° latitude and in deep water (> 40 metres) locations. Wave energy technologies are diverse and less mature than those for tides. Only about 2.3 MWe was installed globally early in 2020, but over 1 GWe of new projects had been announced.
Generators either coupled to floating devices or turned by air displaced by waves in a hollow concrete structure (oscillating water column) are two concepts for producing electricity for delivery to shore. Other experimental devices are submerged and harness the changing pressure as waves pass over them. Ocean Energy Europe reported that capacity installed reached 11.8 MWe in 2019, with 1.5 MWe of that still operational. The remainder had been decommissioned following the end of testing programmes. Another 4.2 MWe of capacity is planned for 2020.
The first commercial wave power plant is in Portugal, with floating rigid segments which pump fluid through turbines as they flex at the joints. It can produce 2.25 MWe. Another – Oyster – is in the UK and is designed to capture the energy found in nearshore waves in water depths of 12 to 16 metres. Each 200-tonne module consists of a large buoyant hinged flap anchored to the seabed. Movement of the flap with each passing wave drives a hydraulic piston to deliver high-pressure water to an onshore turbine which generates electricity. The 315 kW demonstration module being tested in the Orkney Islands is expected to have about a 42% capacity factor.
Near Kaneohe Bay in Hawaii two test units 1-2 km offshore are producing power. Azura is an American anchored buoy extending 4 m above the surface and 16 m below, and it converts wave energy into 18 kW. A 500 kW version is planned. A Norwegian design is an anchored 16-metre diameter buoy which moves its tethering cables to produce 4 kW.
In Australia Carnegie Wave Energy has the Perth Wave Energy Project with three 240 kW CETO 5 units delivering power to the grid. The CETO 5 system consists of buoys that are fully submerged and their movement drives seabed pump units to deliver high pressure fluid via a subsea pipe to standard hydroelectric turbines onshore. A three-unit plant using quite different 1 MW CETO 6 units is being deployed by Carnegie with WaveHub in the UK – these generate power inside the buoyant actuator attached to a pump tethered to the seabed, replacing the closed hydraulic loop with an export cable. The project capacity is now reported as 5 MWe.
Another submerged ocean-surge design is AW-Energy’s WaveRoller. A large vertical panel harnesses up to 2 MW of wave energy and generates power in the fixed power take-off section anchored to the near-shore seabed 8 to 20 metres deep. A 350 kW full-scale module is to be installed near Peniche in Portugal, supported by €10 million from the European Investment Bank.
Numerous practical problems have frustrated progress with wave technology, not least storm damage.
Ocean thermal energy
Ocean thermal energy conversion (OTEC) has long been an attractive idea, but is unproven beyond small pilot plants up to 50 kWe, though in 2015 a 100 kWe closed cycle plant was commissioned in Hawaii and connected to the grid. It works by utilising the temperature difference between equatorial surface waters and cool deep waters, the temperature difference needing to be about 20ºC top to bottom. In the open cycle OTEC the warm surface water is evaporated in a vacuum chamber to produce steam which drives a turbine. It is then condensed in a heat exchanger by the cold water. The main engineering challenge is in the huge cold water pipe which needs to be about 10 m diameter and extend a kilometre deep to enable a large water flow. A closed cycle variation of this uses an ammonia cycle. The ammonia is vapourized by the warm surface waters and drives a turbine before being condensed in a heat exchanger by the cold water. A 10ºC temperature difference is then sufficient.
Biomass
Beyond traditional direct uses for cooking and warmth, growing plant crops particularly wood to burn directly or to make biofuels such as ethanol and biodiesel has a lot of support in several parts of the world, though mostly focused on transport fuel. More recently, wood pellets and chips as biomass for electricity generation have been newsworthy. The main issues here are land and water resources. The land usually must either be removed from agriculture for food or fibre, or it means encroaching upon forests or natural ecosystems. Available fresh water for growing biofuel crops such as maize and sugarcane and for processing them may be another constraint.
Burning biomass for generating electricity has some appeal as a means of indirectly using solar energy for power. It is driven particularly by EU energy policy which classifies it as renewable and ignores the CO2 emissions from burning the wood product. However, the logistics and overall energy balance may defeat it, in that a lot of energy – mostly oil based – is required to harvest and move the crops to the power station. This means that the energy inputs to growing, fertilising and harvesting the crops then processing them can easily be greater than the energy value in the final fuel, and the greenhouse gas emissions can be greater than those from equivalent fossil fuels. Also other environmental impacts related to land use and ecological sustainability can be considerable. For long-term sustainability, the ash containing mineral nutrients needs to be returned to the land.
7.9 million tonnes of wood pellets were exported to Europe from North America in 2018. Some of this comes from low-value forest residues, but increasingly it is direct harvesting of whole trees. Four (out of six) 660 MWe units of Drax, Britain’s largest coal-fired power station, have been converted to burn wood, most of it imported (like the coal of higher heat value that it replaces). Drax demand is now about 7.5 Mt of pellets per year almost entirely from North America. No carbon dioxide emissions are attributed to the actual burning, on the basis that growing replacement wood balances out those emissions, albeit in a multi-decade time frame. Drax figures show 121 g/kWh CO2 for harvesting, preparing and transporting wood pellets to the UK, compared with 32 g/kWh for mined and delivered coal. Burning wood pellets releases about 18% more carbon dioxide than bituminous coal. Unlike coal, the wood needs to be stored under cover. In 2015 Drax received £450 million in subsidies for using biomass – mostly US wood pellets – as fuel, followed by £548 million in 2016. A pilot bioenergy carbon capture storage (BECCS) project – the first in Europe – commenced at Drax in 2018.
In central Europe, wood pellets are burned on a large scale, and it is estimated that about half the wood cut in the EU is burned for electricity or heating.
Worldwide, wood pellet burning is increasing strongly due both to subsidies and national policies related to climate change (since carbon dioxide emissions from it are excluded from national totals). UN data shows pellet production reaching 28 million tonnes in 2015, a rise of more than 40% in three years, with the USA the biggest source. (World statistics available on the Global Timber website.)
In Australia and Latin America sugar cane pulp is burned as a valuable energy source, but this (bagasse) is a by-product of the sugar and does not have to be transported.
In 2018 solid biofuels provided 365 TWh from 83 GWe installed capacity, biogas provided 88 TWh from 18 GWe and municipal waste provided 62 TWh from 13 GWe capacity (IRENA figures).
In 2017 biomass and waste provided 596 TWh of electricity worldwide, from 118 GWe of capacity according to the IEA. By 2030 biomass-fuelled electricity production was projected to triple and provide 2% of the world total, 4% in OECD Europe, as a result of government policies to promote renewables. However, such projections are increasingly challenged as the cost of biofuels in water use and role of biofuels in pushing up food prices is increasingly questioned. In particular, the use of ethanol from corn and biodiesel from soybeans reduces food production and arguably increases world poverty. The cost in subsidies is also increasingly questioned: in the OECD $13-15 billion is spent annually on biofuels which provide only 3% of liquid transport fuel.
Over 2011-2021 about 4 million hectares (40,000 km2) of forest in Southeast Asia and South America are reported by Thomson Reuters to have been cleared for EU biofuel production: 1.1 Mha (11,000 km2) for palm in Southeast Asia and 2.9 Mha (29,000 km2) for soybeans in South America. Most goes into biodiesel.
A legislated portion of the US corn crop is turned into fuel ethanol, aided by heavy subsidies. In 2016 about 134 million tonnes of US corn was used to make 58 GL of fuel ethanol (most of the rest is stock food) and production has declined since. Meanwhile basic food prices rose, leading the Food and Agriculture Organization of the United Nations in mid-2012 to call for the USA to halt its biofuel production to prevent a food crisis. In any case, the energy return on investment (EROI) of corn ethanol in the USA is strongly questioned, and a consensus that it is below the minimum useful threshold is reported. Ethanol is no longer promoted as good for the environment.
Generally, burning biomass for electricity has been put forward as carbon neutral. That too is now questioned on the basis that carbon is released much more quickly than it can be absorbed by growing wood crops, so using round wood for pellets is likely to contribute significant net CO2 emissions for many decades. Using sawmill or logging residues however is not contentious. Some EU states have developed biomass sustainability criteria.
Pedestrian traffic
A new technology, Pavegen, uses pavement tiles about one metre square to harvest energy from pedestrian traffic. A footfall on a tile will flex it about 5mm and result in up to 8 watts of power over the duration of the footstep. Electricity can be stored, used directly for lighting, or in other ways.
Nuclear energy
In recent years there has been discussion as to whether nuclear power can be categorized as “renewable”. In the context of sustainable development it shares many of the benefits of many renewables, it is a low-carbon energy source, it has a very small environmental impact, similarities that are in sharp contrast to fossil fuels. But commonly, nuclear power is categorized separately from ‘renewables’. Nuclear fission power reactors do use a mineral fuel, and demonstrably but minimally deplete the available resources of that fuel.
In the future nuclear power will make use of fast neutron reactors. As well as utilizing about 60 times the amount of energy from uranium, they will unlock the potential of using even more abundant thorium as a fuel. In addition, some 1.5 million tonnes of depleted uranium now seen by some people as little more than a waste, becomes a fuel resource. In effect, they will ‘renew’ their own fuel resource as they operate. The consequence of this is that the available resource of fuel for fast neutron reactors is so plentiful that under no practical terms would the fuel source be significantly depleted.
‘Renewables’, as currently defined, would offer no meaningful advantage over fast neutron reactors in terms of availability of fuel supplies. Most also tend to make very large demands on resources to construct the plant used for harnessing the natural energy – per kilowatt hour produced, much more than nuclear power. Wind turbine plants need over ten times the amount of steel, 15 times the amount of copper and more than twice the amount of other critical minerals than nuclear power per kWh output.
Rotating stabilizer synchronous machines
Inertia is a key element of electricity grid stability. To compensate for the lack of synchronous inertia in generating plant when there is high dependence on wind and solar sources, synchronous condensers, sometimes known as rotating stabilizers, may be added to the system. These are high-inertia rotating machines that can support the grid network in delivering efficient and reliable synchronous inertia and can help stabilize frequency deviations by generating and absorbing reactive power. They behave like a synchronous motor with no load, providing reactive power and short-circuit power to the transmission network.
Synchronous condensers (syncons) are like synchronous motors with no load and not mechanically connected to anything. They may be supplemented by a flywheel to increase inertia. They are used for frequency and voltage control in weak parts of a grid or where there is a high proportion of variable renewable input requiring grid stability to be enhanced. Adding synchronous condensers can help with reactive power needs, increase short-circuit strength and thus system inertia, and assure better dynamic voltage recovery after severe system faults. They can compensate for either a leading or lagging power factor, by absorbing or supplying reactive power (measured in volt-ampere reactive, VAr) to the line. Static synchronous compensators (STATCOM) have a voltage control function, but not the full syncon function.
A leading application is in Germany, where a highly variable flow from offshore wind farms in the north is transmitted to the main load centres in the south, leading to voltage fluctuations and the need for enhanced reactive power control. The reduced inertia in the entire grid made the need to improve short-circuit strength and frequency stability more critical. Germany’s four TSOs have defined a need for 23 to 28 GVAr of synchronous condensers or compensators for reactive power compensation in the network. Amprion has ordered two 600 MVAr static synchronous compensators (STATCOM) from Siemens for Polsum in North Rhine-Westphalia and Rheinau in Baden-Württemberg to help stabilize the power grid as conventional plant closures increase the loss of inertia risk with increasing volatility from renewables. Also a large GE synchronous condenser is installed at Bergrheinfeld in Bavaria.
Following a state-wide blackout, South Australia is installing two GE synchronous condensers at Davenport near Port Augusta and two Siemens units at Robertstown to compensate for a high proportion of wind input to the grid and reduce the vulnerability to further problems from this. These are connected to the 275 kV grid. Also a 190 MVAr Siemens machine is installed at the 265 MWe Kiamal solar PV farm just across the Victorian border near Ouyen.
GE has converted a 625 MWe generator retired from a coal-fired plant to a synchronous condenser of over 500 MVAr, and such conversions, powered from the grid, are often cost-effective. After the 1200 MWe Biblis A nuclear power plant in Germany was retired in 2011 its generator was converted to a synchronous condenser. This now regulates the reactive power from -400 up to +900 MVAr, which is made available to grid operator Amprion in situations of low or high grid voltage.
In the UK, Statkraft plans to install two GE rotating stabilizers to provide stability services to the transmission network in Scotland. These would draw about 1 MWe from the grid and enable many times that of intermittent renewable input, replacing the role of inertia in fossil-fuel or nuclear plants for frequency control. The project is among five innovative grid stability contracts awarded by the National Grid electricity system operator in January 2020.
GE quotes rotor mass of 200 tonnes for its horizontal axis 65 MVAr machine and 400 t for a 200 MVAr vertical axis machine (compared with over 1000 t for a large conventional power plant). In the small Denmark grid, five machines are required to dampen the effect of about 5 GWe of wind capacity. It has a 250 MVAr Siemens syncon at Bjaerskov. Siemens quotes horizontal axis units up to 1300 MVAr, ABB up to 350 MVAr, and GE to 330 MVAr.
Some newer wind turbines are directly coupled and run synchronously at fixed grid-defined rotation speeds, providing some frequency stability, although less total energy output than with DC output.
Large batteries can provide some virtual inertia for frequency control.
Decentralized energy
Centralized state utilities focused on economies of scale can easily overlook an alternative model – of decentralized electricity generation, with that generation being on a smaller scale and close to demand. Here higher costs may be offset by reduced transmission losses (not to mention saving the capital costs of transmission lines) and possibly increased reliability. Generation may be on site or via local mini grids.
Electricity storage at utility scale
In some places pumped hydro storage is used to even out the daily generating load by pumping water to a high storage dam during off-peak hours and weekends, using the excess base-load capacity from low-cost coal or nuclear sources. During peak hours this water can be used for hydro-electric generation. Pumped hydro storage is best suited for providing peak-load power for a system comprising mostly fossil fuel and/or nuclear generation. It is not well suited to filling in for intermittent, unscheduled generation such as wind, where surplus power is irregular and unpredictable.
Relatively few places have scope for pumped storage dams close to where the power is needed, and overall efficiency is 70-75%, but about 120 GWe pumped storage is installed worldwide, including 19 GWe in the USA and 25 GWe in Europe. In 2017, 121 GWh was supplied from pumped storage according to IRENA. There is increasing interest in off-river pumped hydro (ORPH) storage, with pairs of reservoirs having at least 200 metres height difference.
Pumped storage comprised about 95% of the world’s large-scale electricity storage in mid-2018. Building power storage emerged in 2014 as a defining energy technology trend. The market grew by 50% year-on-year, but annual installations fell for the first time in nearly a decade in 2019.
See companion information paper on Electricity and Energy Storage.
Intermittent renewables in relation to base-load demand
It is clear that renewable energy sources have considerable potential to meet mainstream electricity needs. However, having solved the problems of harnessing them there is a further challenge: of integrating them into the supply system where most demand is for continuous, reliable supply. Obviously sun, wind, tides and waves cannot be controlled to provide directly either continuous dispatchable power to meet base-load demand, or peak-load power when it is needed, so how can other, dispatchable sources be operated so as to complement them?
If there were some way that large amounts of electricity from intermittent variable renewable energy (VRE) producers such as solar and wind could be stored efficiently, the contribution of these technologies to supplying electricity demand would be much greater – see preceding subsection. The only renewable source with built-in storage and hence dispatchable on demand is hydro from dams. The storage can be enhanced by pumping back water when power costs are low, and such dammed hydro schemes can be complemented by off-river pumped hydro. This requires pairs of small reservoirs in hilly terrain and joined by a pipe with pump and turbine.
There is some scope for reversing the whole way we look at power supply, in its 24-hour, 7-day cycle, using peak load equipment simply to meet the daily peaks. Conventional peak-load equipment can be used to some extent to provide infill capacity in a system relying heavily on VRE sources such as wind and solar. Its characteristic is rapid start-up, usually (apart from dammed hydro) with low capital and high fuel cost. Such capacity complements large-scale solar thermal and wind generation, providing power at short notice when they were unable to. This is essentially what happens with Denmark, whose wind capacity is complemented by a major link to Norwegian hydro (as well as Sweden and the north German grid).
Case study: West Denmark
West Denmark (the main peninsula part) is the most intensely wind-turbined part of the planet, with 1.74 per 1000 people – 4700 turbines totaling 2315 MWe, 1800 MWe of which has priority dispatch and power must be taken by the grid when it is producing. Total system capacity is 6850 MWe and maximum load during 2002 was 3700 MWe, hence a huge 81% margin. In 2002, 3.38 billion kWh were produced from the wind, a load factor of 16.8%. The peak wind output was 1813 MWe on 23 January, well short of the total capacity, and there were 54 days when the wind output supplied less than 1% of demand. On two occasions, in March and April, wind supplied more than total demand for a few hours. In February 2003 during a cold calm week there was virtually no wind output. Too much wind is also a problem – over 20 m/s output drops and over 25 m/s turbines are feathered. Generally, a one metre/second wind change causes a 320 MWe power change for the whole system.

However, all this can be and is managed due to the major interconnections with Norway, Sweden and Germany, of some 1000 MWe, 600 MWe and 1300 MWe respectively. Furthermore, especially in Norway, hydro resources can normally be called upon, which are ideal for meeting demand at short notice. (though not in 2002 after several dry years). So the Danish example is a very good one, but the circumstances are far from typical.
Case study: Germany
The 2006 report from a thorough study commissioned by the German Energy Agency (DENA) looked at regulating and reserve generation capacity and how it might be deployed as German wind generation doubled to 2015. The study found that only a very small proportion of the installed wind capacity could contribute to reliable supply. Depending on time of year, the gain in guaranteed capacity from wind as a proportion of its total capacity was between 6 and 8% for 14.5 GWe total, and between 5 and 6% for 36 GWe total projected in 2015. This all involves a major additional cost to consumers.
Case study: UK
The performance of every UK wind farm can be seen on the Renewable Energy Foundation website. Note particularly the percentage of installed capacity which is actually delivering power averaged over each month.
If hydro is the back-up and is not abundant, it will be less available for peaking loads. If gas is the back-up this will usually be the best compromise between cost and availability. But any conventional generating plants used as back-up for VRE sources has to be run at lower output than designed to accommodate the intermittent input, and then the lower capacity factor can make them uneconomic, as is now being experienced with many GWe of gas and coal capacity in Germany. The higher the proportion of intermittent input to a system, the greater the diseconomy. This incidentally has adverse CO2 emissions implications. (See sections below).
A further economic effect arises from deploying a lot of wind and solar PV with low marginal generating cost because it creates a substantial increase in the volatility of electricity prices, and at 20% wind/solar or above, zero prices sometimes occur. This value decline caused by wind and solar generating most of their output during times of self-imposed electricity oversupply is marked and it magnifies with their share increasing. German data for 2018 shows that as day-ahead wind & solar power reaches 50 GWe – about half normal demand there – due to self-imposed oversupply the average price drops from about €58/MWh to €20/MWh.
This price effect is not compensated by the price peaks enjoyed by reliable producers when those renewables are insufficient. The price volatility is a major disincentive to investment in new plant, whether nuclear or renewable, if not regulated or subsidized. Since wind and solar PV output correlates with meteorological conditions across a wide area, an increased proportion of them also means that the average price received by those producers – especially solar PV – declines significantly as their penetration increases, magnifying this value decline. At a penetration level of 22.5%, the value of a kilowatt-hour from wind is reduced by 25% in an OECD model*, and in Germany in 2018 the effect was even larger.
* The Costs of Decarbonisation: System Costs with High Shares of Nuclear and Renewables, OECD Nuclear Energy Agency (2019)
In practical terms non-hydro renewables are therefore able to supply up to some 15-20% of the capacity of an electricity grid, though they cannot directly be applied as economic substitutes for most coal or nuclear power, however significant they become in particular areas with favourable conditions. Nevertheless, VRE sources make an important contribution to the world's energy future, even if they cannot carry the main burden of supply. The Global Wind Energy Council expects wind to be able to supply between 10.8 and 15.6% of global electricity by 2030.
In 2014 the OECD International Energy Agency (IEA) published a report on this issue: The Power of Transformation, wind, sun and the economics of flexible power systems. It said that the cost-effective integration of variable renewable energy (VRE) has become a pressing challenge for the energy sector.
At less than 10% VRE, integration poses few challenges, since this is within the range of natural variability of any system. But the study showed that annual VRE shares of 25% to 40% might be achieved from a technical perspective, assuming current levels of system flexibility and sufficient capacity in the system, and assuming that some curtailment of VRE output was accepted (rather than guaranteed priority access to grid for VRE). “However, mobilising system flexibility to its technical maximum can be considerably more expensive than least-cost system operation.”
Meanwhile Germany provides a case study in accelerated integration of VRE into a stable system, with both politically- and economically-forced retirement of conventional generating capacity. See also the information paper on Energiewende.
In the USA since 1992 a production tax credit (PTC) has applied for wind, peaking in 2016 at $23/MWh net, compared with a wholesale price usually not much above that. In 2020 it was extended at $18/MWh. Thus the PTC meant that intermittent wind generators could dump power on the market to the extent of depressing the wholesale price so that other generators were operating at a loss. This market distortion has created major problems for the viability of dispatchable generation sources upon which the market depends.
Intermittency and grid management
Grid management authorities faced with the need to be able to dispatch power at short notice treat wind-generated power not as an available source of supply which can be called upon when needed but as an unpredictable drop in demand. In any case wind needs about 90% back-up, whereas the level of back-up for other forms of power generation which can be called upon on demand is around 25%, simply allowing for maintenance downtime.
Modelling done by the UK National Grid Corporation shows the effect of wind's unreliability on the required plant for achieving the 20% UK renewables target:
| Contribution from wind % of 400 TWh |
Wind capacity GWe | Conventional capacity GWe | Spare capacity GWe |
|
2%
|
0.5
|
59
|
9.5
|
|
5%
|
7.5
|
57
|
14.5
|
|
20%
|
25
|
55
|
30
|

Thus, building 25 GWe of wind capacity, equivalent to almost half of UK peak demand, will only reduce the need for conventional fossil and nuclear plant capacity by 6.7%. Also, some 30 GWe of spare capacity will need to be on immediate call continuously to provide a normal margin of reserve and to back up the wind plant's inability to produce power on demand – about two-thirds of it being for the latter.
Ensuring both secure continuity of supply (reliably meeting peak power demands) and its quality (voltage and frequency control) means that the actual potential for wind and solar input to a system is limited. Doing so economically, as evident from the above UK figures, requires low-cost back-up such as hydro, or gas turbine with cheap fuel. For the UK, with little interconnection beyond its shores, a 20% renewables target is difficult and more than that has significant cost and reliability implications.
Because wind turbine output is so variable, for planning purposes its potential output is discounted to the level of power that can be relied upon for 90% of the time. In Australia that figure comes to 7% of installed wind capacity, in Germany it is 8%, which is all that can be included as securely available (i.e. 90% of the time).* On the 90% availability basis, other technologies can be counted on for much higher reliability, and hence the investment cost per kilowatt reliably available is much less.
* Figures from NEMMCO and E.ON respectively.
Nuclear power plants are essentially base-load generators, running continuously. Where it is necessary to vary the output according to daily and weekly load cycles, for instance in France, where there is a very high reliance on nuclear power, they can be adapted to load-follow. For BWRs this is reasonably easy without burning the core unevenly, but for a PWR (as in France) to run at less than full power for much of the time depends on where it is in the 18 to 24-month refueling cycle, and whether it is designed with special control rods which diminish power levels throughout the core without shutting it down. So while the ability on any individual PWR reactor to run on a sustained basis at low power decreases markedly as it progresses through the refueling cycle, there is considerable scope for running a fleet of reactors in load-following mode. Generation III plants and small modular reactors have more scope for load-following, and as fast neutron reactors become more established, their ability in this regard will be an asset.
If electricity cannot be stored on a large scale, the next logical step is to look at products of its use which can be stored, and hence where intermittent electricity supply is not a problem.
System integration costs of intermittent renewable power generation
Power generation technologies generally compete with each other both in regulated and deregulated markets to supply electricity through a ‘merit order’ based on availability and marginal cost of production for any given period. Fossil fuel, nuclear, biomass and hydro power generators can all to varying degrees supply electricity ‘on demand’, in other words supply from these sources can be called upon or adjusted to meet demand. In contrast to renewable hydro, the feed-in of wind and solar output is uncontrollably intermittent due to the uncertainty of meteorological conditions. In grid management terms they are not dispatchable. Therefore the energy system needs backup capacity from the on-demand-sources to bridge periods with high or low generation from renewables. To some extent battery storage can help, though most grid-scale battery installations are more for ancillary services (frequency control etc.) rather than energy storage. See also Electricity and Energy Storage information page.
The intermittency of wind and solar generation at capacity factors of around 30% and 20% respectively means that three or four times as much capacity of these needs to be built to achieve the same market share as dispatchable sources. Nuclear power’s average load factor is about 75%; thus to generate an equivalent amount of potential power to nuclear on the basis of these load factors, it is necessary to install three or four times as much wind capacity*. But that is not the main problem.
* This factor is likely to deteriorate over time as the optimal sites for wind and solar are progressively used, leaving only less favourable sites.
Wind and solar power supply is largely governed by wind speed and the level of sunlight, which can only loosely be related to periods of power demand. It is this feature of intermittent renewable power supply that results in the imposition of additional costs on the generating system as a whole.
The IEA disaggregates these system costs into three components:
- Adequacy costs: the cost of ensuring that the power system has sufficient capacity to meet peak loads.
- Balancing costs: the cost of ensuring that the power system can respond flexibly to demand changes at any given time.
- Interconnection costs: the cost of linking sources of supply to sources of demand.
As noted above, additional back-up capacity is needed to meet demand rapidly when meteorological conditions result in insufficient wind and solar power generation. The adequacy and balancing capacity must itself have a high degree of availability, ie, it should be from a dispatchable source. This reserve or backup capacity is most likely to be needed during periods of high demand and lack of wind and solar, for instance on a calm winter’s evening. In such a situation significant levels of dispatchable backup capacity are needed to ensure security of supply.
The third category of intermittent renewable integration cost is grid interconnection. Wind and solar farms are ideally sited in areas that experience high average wind speeds and high average solar radiation respectively. These sites are often, even typically, distant from areas of electricity demand. Transmission and distribution networks will often need to be extended significantly to connect sources of supply and demand - this is a current challenge in UK and North Germany.
There is another category of costs that result from the operation of renewables and these can be described as the external costs borne by other power producers, in particular base-load power producers, as a result of intermittency. The structure of wind and solar levelized generation costs is characterized by high capital, significant O&M costs and zero fuel costs. As a result, the operating costs for these sources are very low and when power is generated they undercut and are able to displace all other sources of power in a utility’s merit order. In a situation of high levels of wind and solar power penetration and during periods of low demand, baseload generators will be displaced in the merit order. This is also required by legislation in many countries.
The impact of high levels of intermittent, low cost power will be to reduce the load factors of base-load power generators, and thereby increase their unit costs per kilowatt-hour. Given the high capital costs of nuclear, such an impact will significantly increase the levelized generation costs of nuclear. For example, a 15% decrease in the capacity factor of a nuclear power plant could increase its levelized cost by about 24%.
The Hydrogen Economy
Hydrogen is widely seen as a possible fuel for transport, if certain problems can be overcome economically. It may be used in conventional internal combustion engines, or in fuel cells which convert chemical energy directly to electricity without normal burning.
Making hydrogen requires either reforming natural gas (methane) with steam, or the electrolysis of water. The former process has carbon dioxide as a by-product, which exacerbates (or at least does not improve) greenhouse gas emissions relative to present technology. With electrolysis, the greenhouse burden depends on the source of the power.
With intermittent renewables such as solar and wind, matching the output to grid demand is very difficult, and beyond about 20% of the total supply, the system costs overwhelm generation costs. But if these sources are used for electricity to make hydrogen, then they can be utilised fully whenever they are available, opportunistically. Broadly speaking it does not matter when they cut in or out, the hydrogen is simply stored and used as required. However, electrolysers are inefficient at low capacity factors such as even dedicated wind or solar input would supply.
A quite different rationale applies to using nuclear energy (or any other emission-free base-load plant) for hydrogen. Here the plant would be run continuously at full capacity, with perhaps all the output being supplied to the grid in peak periods and any not needed to meet civil demand being used to make hydrogen at other times. This would mean maximum efficiency for the nuclear power plants, and that hydrogen was made opportunistically when it suited the grid manager, with electrolyser capacity factors above 65% readily achieved.
About 55 kWh is required to produce a kilogram of hydrogen by electrolysis at ambient temperature, so the cost of the electricity clearly is crucial.
Environmental Aspects
Renewable energy sources have a completely different set of environmental costs and benefits to fossil fuel or nuclear generating capacity.
On the positive side they emit no carbon dioxide or other air pollutants (beyond some decay products from new hydro-electric reservoirs), but because they are harnessing relatively low-intensity energy, their 'footprint' – the area taken up by them – is necessarily much larger.
Whether Australia could accept the environmental impact of another Snowy Mountains hydro scheme (providing some 3.5% of the country's electricity plus irrigation) is doubtful. Whether large areas near cities dedicated to solar collectors will be acceptable, if such proposals are ever made, remains to be seen. Beyond utilising roofs, 1000 MWe of solar capacity would require at least 20 square kilometres of collectors, shading a lot of country.
In Europe, wind turbines have not endeared themselves to neighbours on aesthetic, noise or nature conservation grounds, and this has arrested their deployment in UK. At the same time, European non-fossil fuel obligations have led the establishment of major offshore wind forms and the prospect of more.
However, much environmental impact can be reduced. Fixed solar collectors can double as noise barriers along highways, roof-tops are available already, and there are places where wind turbines would not obtrude unduly.
APPENDIX: Government Support for Renewables Deployment
In an open market, government policies to support particular generation options such as renewables normally give rise to explicit direct subsidies along with other instruments such as feed-in tariffs, quota obligations and energy tax exemptions. In the EU, feed-in tariffs are widespread.
Corresponding to these in the other direction are taxes on particular energy sources, justified by climate change or related policies. For instance Sweden taxes nuclear power at about EUR 0.6 cents/kWh.
European Environment Agency figures in 2004 gave indicative estimates of total energy subsidies in the EU-15 for 2001: solid fuel (coal) EUR 13.0, oil & gas EUR 8.7, nuclear EUR 2.2, renewables EUR 5.3 billion.
The Global Wind Energy Council (2008) reported that "In the pursuit of the overall target of 21% from renewable electricity by 2010, the Renewable Electricity Directive 2001 gives EU Member States freedom of choice regarding support mechanisms. Thus, various schemes are operating in Europe, mainly feed-in tariffs, fixed premiums, green certificate systems and tendering procedures. These schemes are generally complemented by tax incentives, environmental taxes, contribution programs or voluntary agreements."
France had a feed-in tariff of EUR 8.2 c/kWh to 2012, which then woiuld decrease.
Germany's Renewable Energy Sources Act gives renewables priority for grid access and power dispatch. It is regularly amended to adapt feed-in tariffs to market conditions and technological developments. For wind energy an initial tariff applies for up to 20 years and this then reduces to a basic tariff of EUR 5.02 c/kWh. The initial tariff is EUR 9.2 c/kWh for onshore wind and 15 c/kWh for offshore wind from January 2009. The combined subsidy from consumers and government totals some €5 billion per year – for 7.5% of its electricity.
Denmark has a wide range of incentives for renewables and particularly wind energy. It has a complex 'Green Certificate' scheme which transfers the subsidy cost to consumers. However, there is a further economic cost borne by power utilities and customers. When there is a drop in wind, back-up power is bought from the Nordic power pool at the going rate. Similarly, any surplus (subsidized) wind power is sold to the pool at the prevailing price, which is sometimes zero . The net effect of this is growing losses as wind capacity expands.
Italy in 2008 legislated to provide EUR 18 c/kWh on a quota system for wind power.
Spain has different levels of feed-in tariffs depending on the technology used. A fixed tariff of EUR 7.32 c/kWh is one option, or a fixed premium of 2.93 c/kWh on the market price (but with a floor of 7.13 cents) is the other, as of 2008. The tariffs for renewables are adjusted every four years.
Greece has a feed-in tariff of 6.1-7.5 c/kWh, whereas the Netherlands relies on exemption from energy taxes to encourage renewables.
The UK has not used any feed-in tariff arrangement, but is to do so from 2010. Meanwhile a specific indication of the cost increment over power generation from other sources is given by the 4.5-5.0 p/kWh market value for the Renewables Obligation, by which utilities can cover the shortfall in producing a certain proportion of their electricity from renewables by paying this amount and passing the cost on to the consumer. In addition there is a Climate Change Levy of 0.43 p/kWh on non-renewable sources (at present including nuclear energy, despite its lack of greenhouse gas emissions), which corresponds to a subsidy.
Sweden subsidizes renewables (principally large-scale hydro) by a tax on nuclear capacity, which works out at about EUR 0.67 cents/kWh from 2008. For wind, there is a quota system requiring utilities to buy a certain amount of renewable energy by purchasing certificates.
In Norway the government subsidises wind energy with a 25% investment grant and then production support per kWh, the total coming to NOK 0.12/kWh, against a spot price of around NOK 0.18/kWh (US$ 1.3 cents & 2 cents respectively).
In the USA the wind energy production tax credit (PTC) of 1.5 c/kWh indexed to inflation (peaked at 2.3 c/kWh) has provided incentive, though this expires every two years before being renewed by Congress.
Canada provides a production incentive payment of 1c/kWh for wind power, plus feed-in tariffs.
In Australia energy retailers are required to source specified quantities of power from new (non hydro) renewables. The obligation is tradeable and there is a fallback tax of AUD 4 c/kWh for retailers failing to comply.
In India ten out of 29 states have feed-in tariffs, eg 2.75 times the tariff for coal-generated power in Karnataka, plus a federal incentive scheme paying one third of the coal-fired tariff.
Small-scale PV input is encouraged by high feed-in tariffs, eg 48 c/kWh in Germany and 50 c/kWh in Portugal.
Notes & references
General sources
OECD NEA 2012, Nuclear Energy and Renewables – system effects in low-carbon electricity systems.
REN21 Renewables Global Status Report, 2013
Gordon Hughes, The Performance of Wind Farms in the United Kingdom and Denmark, Renewable Energy Foundation (2012)
David MacKay, On the Performance of Wind Farms in the United Kingdom (response to Hughes, The Performance of Wind Farms in the United Kingdom and Denmark), University of Cambridge and Department of Energy and Climate Change (28 May 2013)
International Energy Agency, Energy Technology Perspectives 2016
Carey Institute of Ecosystem Studies, Re: Problems with burning wood from Southern US forests to generate electricity in the UK (letter to Edward Davey, Secretary of State for Energy and Climate Change, and David MacKay, Chief Scientific Advisor to the Department of Energy and Climate Change, 24 April 2014)
International Renewable Energy Agency (IRENA) statistics
Gail Tverberg, 2016, Intermittent renewables can’t favourably transform grid electricity, Our Finite World (31 August 2016)
Lion Hirth, The Market Value of Variable Renewables, Energy Economics, 38, 218-236 (July 2013)
References
1. J. Ryan Zimmerling et al., Canadian Estimate of Bird Mortality Due to Collisions and Direct Habitat Loss Associated with Wind Turbine Developments, Avian Conservation and Ecology, 8(2): 10. [Back]
Related information
'Clean Coal' TechnologiesPolicy Responses to Climate Change
Electricity and Energy Storage