Uranium Markets
- Production from world uranium mines has in recent years supplied 90% of the requirements of power utilities.
- Primary production from mines is supplemented by secondary supplies, formerly most from ex-military material but now the products of recycling and stockpiles built up in times of reduced demand.
All mineral commodity markets tend to be cyclical (i.e. prices rise and fall substantially over the years) but these fluctuations tend to be superimposed on a long-term trend decline in real prices, as technological progress reduces production cost at mines. In the uranium market, however, high prices in the late 1970s gave way to depressed prices in the whole of the period of the 1980s and 1990s, with spot prices below the cost of production for all but the lowest cost mines. Spot prices recovered from 2003 to 2009, but have been weak since then.
The quoted spot prices through to about 2007 applied only to day-to-day marginal trading and represented a small portion of supply, though since 2008 the proportion has approximately doubled, to about one-quarter in the last decade. Most trade is via 3-15 year term contracts with producers selling directly to utilities at a higher price than the spot market, reflecting the security of supply. The specified price in these contracts is, however, often related to the spot price at the time of delivery.
In 2000, primary market participants – utilities and producers – accounted for 95% of the spot market. That share decreased to two-thirds by 2005 and one-third by 2011 and it has remained at 30-40% since. The rest comes from the financial community, namely traders and financiers who have moved in on the market, bringing greater liquidity and efficiency.
The reasons for fluctuation in mineral prices relate to demand and perceptions of scarcity. The price cannot indefinitely stay below the cost of production, nor will it remain at very high levels for longer than it takes for new producers to enter the market and anxiety about supply to subside.
Spot and long-term uranium prices (2000-2023)
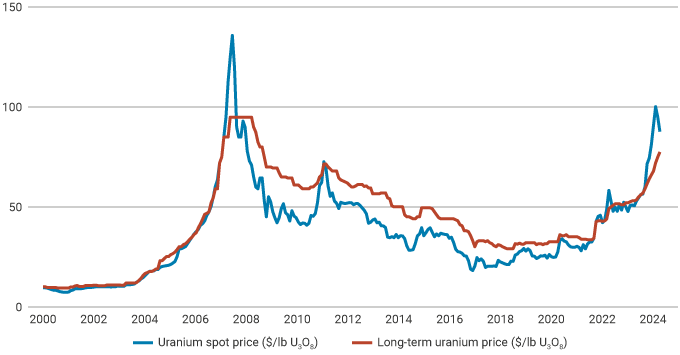
Source: Cameco, UxC, TradeTech
Demand
About 440 reactors with combined capacity of about 390 GWe require some 80,000 tonnes of uranium oxide concentrate containing about 67,500 tonnes of uranium (tU) from mines (or the equivalent from stockpiles or secondary sources) each year. This includes initial cores for new reactors coming online. The capacity is growing slowly, and at the same time the reactors are being run more productively, with higher capacity factors, and reactor power levels. However, these factors increasing fuel demand are offset by a trend for increased efficiencies, so demand is dampened – over the 20 years from 1970 there was a 25% reduction in uranium demand per kWh output in Europe due to such improvements, which continue today.
Each GWe of increased new capacity will require about 150 tU/yr of extra mine production routinely, and about 300-450 tU for the first fuel load.
Fuel burn-up is measured in units such as MW days per tonne U (MWd/tU). Increases in burn-up reduce the number of fresh fuel assemblies which need to be loaded. Higher burn-ups therefore result in potential cost savings for the utility at both ends of the fuel cycle. However, increases in burn-up sometimes (but not always) require increased enrichment levels in the fuel assemblies, which increases the uranium and/or the enrichment needed for each assembly, thus increasing the cost of each assembly. During 1980-2010 burn-up levels increased, compared with original designs, to around 40,000 MWd/tU for most LWRs, with reductions in specific uranium consumption. Some utilities have continued to increase burn-ups further, and levels of 45-50 GWd/tU are now common. However, increasing burn-up above 40 GWd/tU only reduces specific uranium consumption slightly, while very slightly increasing specific enrichment requirements. For example, an increase from 40 to 50 GWd/tU reduces uranium requirements by 4-5% and increases enrichment requirements by about 2-3%.
Generally, utilities have pursued higher enrichment and burn-ups, and when uranium prices were high they specified low tails assays from enrichment, to get more fuel from it, so that significantly less natural uranium feed was required. However, more enrichment energy was then needed. There is a clear trade-off between energy input to enrichment and uranium input.
Percentage variation in uranium requirements and separative work unit (SWU) requirements with different tails assays
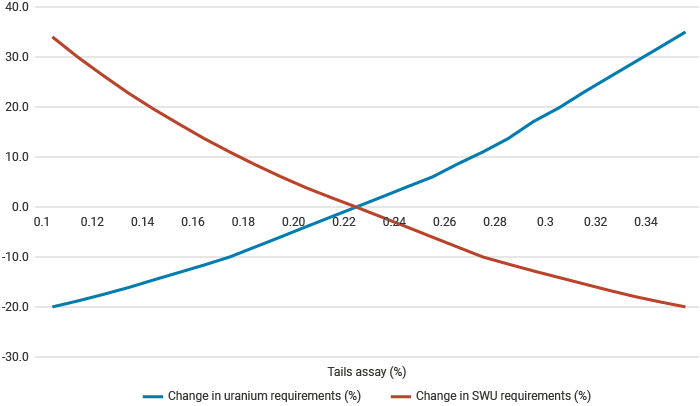
Notes: from a base tails assay of 0.22% U-235
Source: World Nuclear Association
Because of the cost structure of nuclear power generation, with high capital and low fuel costs, the demand for uranium fuel is much more predictable than with probably any other mineral commodity. Once reactors are built, it is very cost-effective to keep them running at high capacity and for utilities to make any adjustments to load trends by cutting back on fossil fuel use. Demand forecasts for uranium thus depend largely on installed and operable capacity, regardless of economic fluctuations. However, this picture is complicated by policies which give preferential grid access to subsidized wind and solar PV sources.
Looking ten years ahead, the market is expected to grow. The Reference Scenario of the 2023 edition of the World Nuclear Association's Nuclear Fuel Report shows a 28% increase in uranium demand over 2023-30 (for an 18% increase in reactor capacity – many new cores will be required). Demand thereafter will depend on new plants being built and the rate at which older plants are retired – the Reference Scenario of the 2023 Nuclear Fuel Report has a 51% increase in uranium demand for the decade 2031-2040. Licensing of plant lifetime extensions and the economic attractiveness of continued operation of older reactors are critical factors in the medium-term uranium market. However, with electricity demand by 2040 potentially increasing by about 50% from that of 2022 (based on the International Energy Agency's World Energy Outlook 2023 report), there is plenty of scope for growth in nuclear capacity in a world concerned with limiting carbon emissions.
Supply
Mines in 2022 supplied some 58,201 tonnes of uranium oxide concentrate (U3O8) containing 49,355 tU, 74% of the utilities' annual requirements (see also information page on World Uranium Mining). The balance is made up from secondary sources including stockpiled uranium held by utilities, and in the last few years of low prices those civil stockpiles have been built up again following their depletion over 1990-2005. At the end of 2022 they were estimated at about 36,000 tU in Europe, 40,000 tU in the USA, about 132,000 tU in China, and about 49,000 tU in the rest of Asia.
Note that at the prices which utilities are likely to be paying for current delivery, only one-third of the cost of the fuel loaded into a nuclear reactor is the actual ex-mine (or other) supply. The balance is mostly the cost of enrichment and fuel fabrication, with a small element for uranium conversion.
With the main growth in uranium demand being in Russia and China, it is noteworthy that the vertically-integrated sovereign nuclear industries in these countries (and potentially India) have sought equity in uranium mines abroad, bypassing the market to some extent. Strategic investment in uranium production, even if it is not lowest-cost, has become the priority while world prices have been generally low. Russia’s ARMZ bought Canada-based Uranium One in 2013, and China holds equity in mines in Niger, Namibia, Kazakhstan, Uzbekistan and Canada.
Supply from elsewhere
As well as existing and likely new mines, nuclear fuel supply may be from secondary sources including:
- Recycled uranium and plutonium from used fuel, as mixed oxide (MOX) fuel.
- Re-enriched depleted uranium tails.
- Ex-military weapons-grade uranium, blended down.
- Civil stockpiles.
- Ex-military weapons-grade plutonium, as MOX fuel.
Commercial reprocessing plants are operating in France and Russia with a combined capacity of about 2000 tonnes of heavy metal (tHM) per year. World reprocessing capacity would increase by 800 tHM with the restart of the Japanese plant at Rokkasho-Mura. Further capacity is under construction in Russia and China, and there are a number of other plants with small reprocessing capacities worldwide.
Military uranium for weapons was enriched to much higher levels than that for the civil fuel cycle. Weapons-grade material is about 97% U-235, and this can be diluted about 25:1 with depleted uranium (or 30:1 with enriched depleted uranium) to reduce it to about 4%, suitable for use in a power reactor. From 1999 to 2013 the dilution of 30 tonnes per year of such material displaced about 9720 tonnes U3O8 per year of mine production. (See also page on Military Warheads as a Source of Nuclear Fuel.)
The following graph gives an historical perspective, showing how early production went first into military inventories and then, in the early 1980s, into civil stockpiles. It is this early production which has made up the shortfall in supply from mines since the mid-1980s. However, the shortfall is diminishing towards the level of continuing secondary supplies.
World uranium production and reactor requirements, 1945-2022, tU
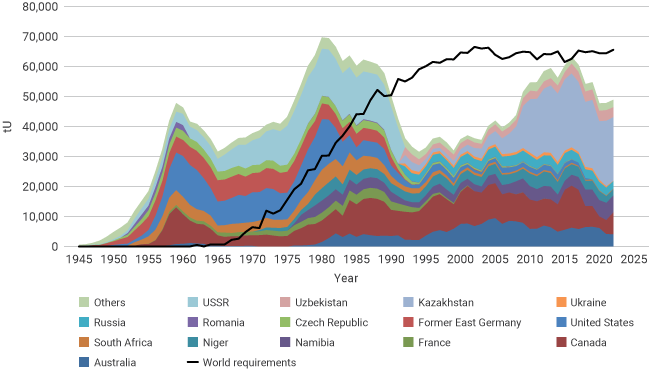
Source: OECD-NEA, IAEA, World Nuclear Association
The following graph suggests how these various sources of supply might look in the decades ahead. The graph shows a breakdown of the Reference Scenario of the 2023 edition of World Nuclear Association's Nuclear Fuel Report into current mine capacity (with idled capacity separated), and capacity that is under development, planned or prospective. The black line shows the Reference Scenario of the 2021 edition of The Nuclear Fuel Report for comparison. To meet the Reference Scenario requirements from early in the next decade, in addition to restarted idled mines, mines under development, planned mines and prospective mines, other new projects will need to be brought into production. Considerable exploration, innovative techniques and timely investment would be required to turn these resources into refined uranium ready for nuclear fuel production within this time frame.
Reference Scenario for uranium production, tU
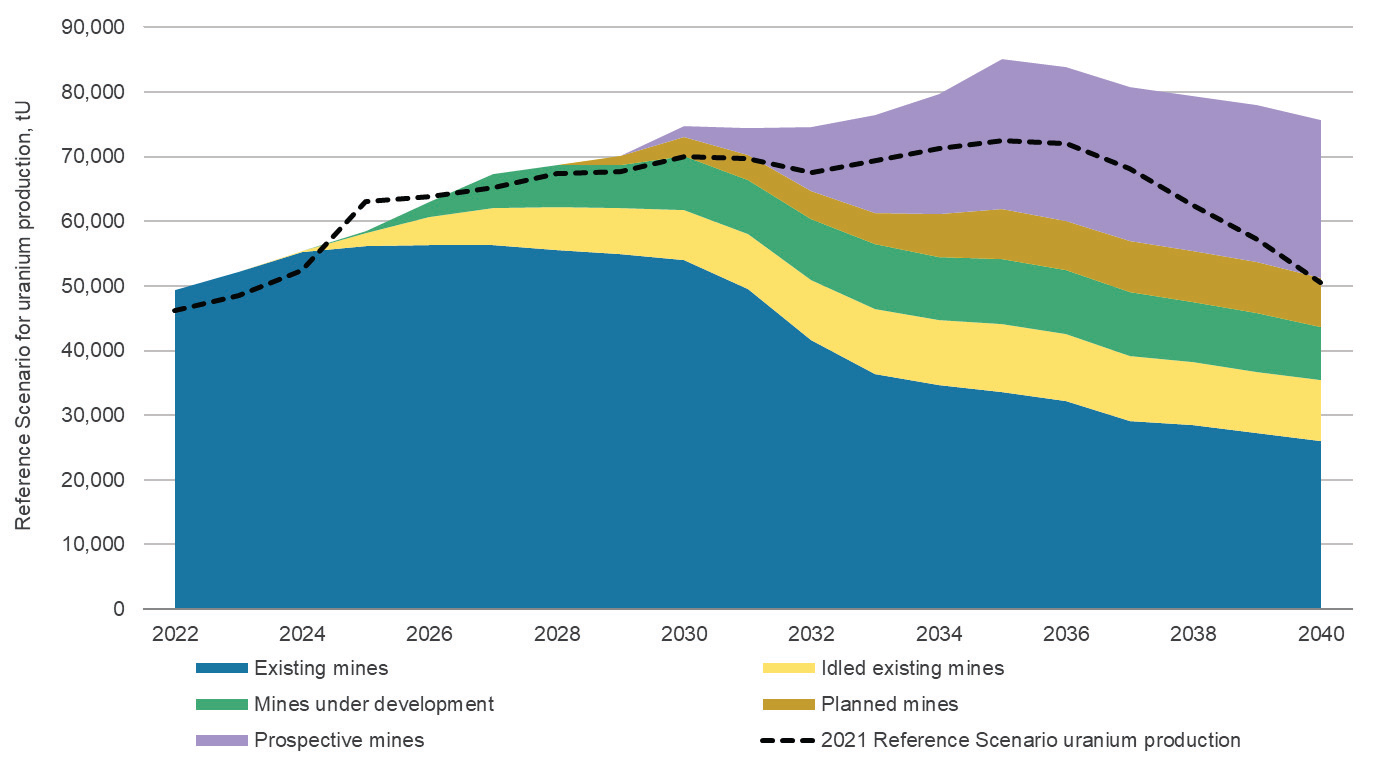
Source: The Nuclear Fuel Report, World Nuclear Association
Notes & references
Sources
World Nuclear Association, The Nuclear Fuel Report
International Energy Agency, World Energy Outlook
Related information
Uranium Production by CountryMilitary Warheads as a Source of Nuclear Fuel
World Nuclear Power Reactors and Uranium Requirements