Energy Subsidies
(Updated February 2018)
- Substantial amounts have been invested in energy R&D over the last 50 years. Much of this has been directed at developing nuclear energy – which now supplies 11% of world electricity.
- Today, combined investment in energy efficiency, renewables and hydrogen & fuel cells is about twice that of nuclear, but with less to show for it in terms of electricity supply.
- Nowhere in the world is nuclear power subsidised per unit of production. In some countries, however, it is taxed because production costs are so low.
- Renewables have received heavy direct subsidies in the market by various means, but these are being scaled back in many places due to the rapidly increasing cost to consumers.
- Fossil fuels receive indirect subsidies in their waste disposal as well as some, increasingly controversial, direct subsidies.
The term “subsidy” is not easily definable. There is widespread agreement that subsidisation involves the government and results in benefits for somebody, but the details of the concept remain ambiguous.
The World Trade Organization (WTO), in its 2006 World Trade Report, defines three types of government programs that constitute subsidies:
- Financial transfers made by the government that result in (actual or potential) budgetary outlays, as well as transfers that are made by private entities, as mandated by government.
- Programs that involve the provision of goods or services at no cost or below market price.
- Regulatory policies or preferential rules that result in transfers from one group to another, conferring a benefit to the recipient.
The WTO definition explicitly recognises that subsidies need not come from government directly. Rather, government can require private actors such as electricity consumers to pay subsidies by creating corresponding regulations or legislation.
There are three main areas where, broadly speaking, subsidies or other support for energy may apply:
- Energy R&D – government research & development (R&D) for particular technologies.
- Direct subsidies – per unit of production (or conceivably per unit of capacity), including costs imposed on disincentivised alternatives. Quota obligations are another form of widely used direct subsidy.
- Indirect subsidies – the allowance of external costs which are either paid by the community at large or picked up later by governments.
Government intervention in energy markets, such as in the UK under its Electricity Market Reform (EMR), may result in subsidisation or taxation. They are ‘trade distortions’ according to the WTO’s definition, but may be justified as a means of environmental protection.
Energy R&D
There has been a lot of government-financed energy R&D in most developed countries. The OECD International Energy Administration (IEA) estimates that in 2015, across IEA member countries, public energy R&D spending was about $12.7 billion. Much of the investment has been driven by concern about energy supply and security, as well the need to address environmental problems and social concerns. Reliable and affordable energy supplies are vital to any economy, while energy shortages, or the threat of such, can have profound political and economic consequences. As concerns have evolved from oil shocks to climate change, each country's requirements for investment in energy provision and infrastructure have required restructuring accordingly.
Generally, government-led R&D expenditure targets long-term development of new technologies, with the aim of progressing some to commercialisation in the mid- to long-term. By contrast, private capital is typically deployed on shorter time horizons, and consequently focused on the short-term advancement of existing technologies. While there are notable exceptions both ways, there is a strong disincentive for industry working in highly competitive markets, and needing to achieve quick returns on capital to shareholders, to undertake long-term, high risk R&D.
Nuclear energy R&D versus renewables and other energy sources
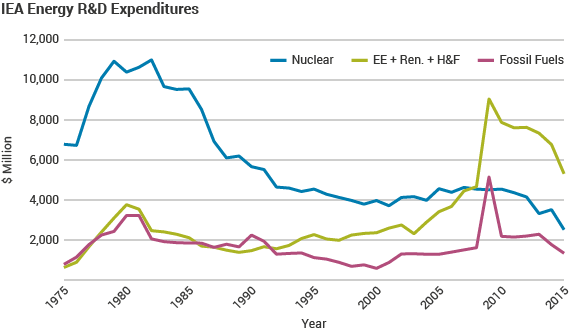
Nuclear R&D has decreased materially in relative terms since the 1970s as investment has become more diverse. The IEA estimates that 20% of the public R&D energy budget was invested in nuclear technologies in 2015, down from nearly 73% in 1975. Over the same period, investment in energy efficiency and renewables has increased markedly, with each attracting similar shares of total energy R&D to nuclear in 2015.
| Year |
1975 |
1980 |
1985 |
1990 |
1995 |
2000 |
2005 |
2010 |
2015 |
| Energy efficiency |
377
|
1276
|
1026
|
742
|
1371
|
1547
|
1461
|
3588
|
2394
|
| Fossil fuels |
783
|
3224
|
1848
|
2242
|
1120
|
583
|
1287
|
2184
|
1339
|
| Hydrogen & fuel cells |
|
|
|
|
|
|
792
|
811
|
377
|
| Nuclear |
6785
|
10394
|
9557
|
5666
|
4546
|
3973
|
4564
|
4543
|
2519
|
| Renewables |
253
|
2489
|
1089
|
726
|
899
|
816
|
1163
|
3481
|
2545
|
| Other power & storage |
208
|
557
|
334
|
311
|
415
|
581
|
446
|
867
|
785
|
| Other cross-cutting technologies |
929
|
1544
|
1057
|
1298
|
1468
|
1527
|
1488
|
537
|
2545
|
| Unallocated |
|
|
|
|
|
|
|
|
202
|
|
Total energy R&D
|
9336
|
19,483
|
14,910
|
10,986
|
9819
|
9025
|
11,199
|
16,011
|
12,706
|
|
Total: Japan
|
1139
|
2593
|
2931
|
2717
|
3164
|
3179
|
3316
|
2937
|
2416
|
|
Total: excluding Japan
|
8197
|
16,890
|
11,979
|
8268
|
6655
|
5846
|
7883
|
13,074
|
10,290
|
All figures in 2015 US$ millions; EE+Ren.+H&F = energy efficiency, renewables and hydrogen & fuel cells
The above table and graphs are from the OECD IEA’s database regarding public expenditure in the 26 IEA member countries. The database does not include information about private companies' expenditure, nor funds spent by major energy producing non-IEA countries, such as China, Russia or India.
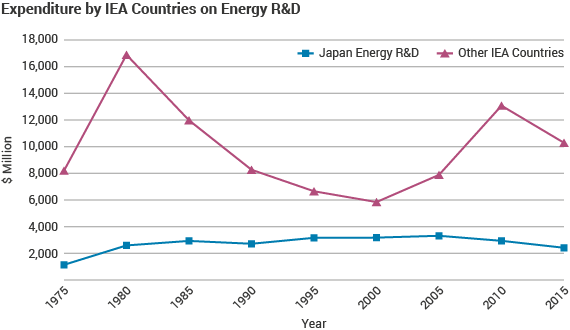
The total amount of energy R&D expenditure by governments of IEA countries rose in response to the oil price shocks of the early 1970s and then fell away as associated concerns abated, with the conspicuous exception of Japan. While datasets are less readily available, private R&D investment has apparently followed the same pattern outside Japan.
Throughout the period between 1975 and 2005, expenditure on nuclear R&D dominated the overall figures, despite falling from 73% of the total in 1975 to 41% in 2005. IEA data shows that R&D on nuclear peaked in 1982 and has declined steadily since to less than half of that level.
In 2010, global energy R&D expenditure reached record levels, leading to a decline in the relative share of nuclear R&D expenditure (absolute nuclear R&D expenditure remained broadly stable). Between 2010 and 2015 overall energy R&D expenditure declined by 21%, with nuclear-specific expenditure declining by 45%. Over the period as a whole, absolute spending on nuclear R&D has fallen in most countries, with, until recently, the notable exception of Japan. The Japan Atomic Energy Agency (JAEA) is the major integrated nuclear R&D organisation in the country, with over 10 facilities and in excess of 1000 employees. Since 1990, Japan and France have dominated global nuclear R&D, together accounting for an estimated 64% of expenditure.
Nuclear R&D expenditure by IEA countries
| |
UK |
France |
Japan |
USA |
Other IEA countries |
All IEA countries |
| 1975 |
1034 |
0 |
642 |
3123 |
1986 |
6785 |
| 1980 |
859 |
952 |
1933 |
3774 |
2876 |
10,394 |
| 1985 |
751 |
993 |
2277 |
2313 |
3222 |
9557 |
| 1990 |
322 |
616 |
2203 |
1406 |
1119 |
5666 |
| 1995 |
56 |
656 |
2374 |
666 |
794 |
4546 |
| 2000 |
37 |
716 |
2248 |
369 |
602 |
3973 |
| 2005 |
42 |
612 |
2160 |
899 |
851 |
4564 |
| 2010 |
117 |
481 |
2053 |
971 |
920 |
4543 |
| 2015 |
? |
? |
952 |
904 |
664 |
2519 |
2015 US$ millions
Since the turn of the century, R&D expenditure on renewables, energy efficiency and hydrogen & fuel cells has risen markedly, surpassing nuclear related expenditure for the first time in 2009, and accounting for an estimated 42% of total energy R&D expenditure in 2015. Renewable investment is likely to continue to increase, but despite the extent of investment, their potential contribution is likely to be limited. By nature, the key sources of renewable energy – solar and wind – are diffuse and intermittent.
Outside the IEA, Russia, India and China have substantial nuclear fission programs and as the European Union also funds an amount of nuclear R&D, the worldwide totals will be notably higher than the figures presented above. Nonetheless, given that the bulk of government-sponsored R&D into nuclear focuses on waste management and other fuel cycle back-end processes, it is clear that little is being spent by governments at present on new reactor designs.
Direct subsidies
As discussed above, the term “subsidy” is difficult to define. What matters in practice is the overall impact of all subsidies and taxes on the absolute level of prices and costs, and the resultant impact on the competitiveness of different fuels or technology.
In addition to front-end R&D expenditure there are ongoing operational subsidies for various forms and sources of energy. With government-controlled utilities, or regulated markets such as in the USA until the mid-1990s, utility costs could simply be passed onto the consumers, who effectively supplied a subsidy relative to cheaper alternatives. With deregulated and competitive markets this changed.
In an open market, government policies to support particular generation options such as renewables normally give rise to explicit direct subsidies along with other instruments such as feed-in tariffs (FITs), quota obligations and energy tax exemptions. To disincentivise the use of alternatives, a government may introduce targeted policies including carbon taxes, or emission trading schemes for carbon.
From about 2014 numerous subsidy schemes for renewables have started to be cut back. The UK, Spain, Germany, Italy, Switzerland and Australia have taken steps to reduce various subsides as costs to consumers since their introduction have increased considerably.
Despite recent cutbacks, the IEA's World Energy Outlook 2016 estimates that subsidies paid to renewable energy will peak just above $210 billion in 2030, before declining to about $170 billion by 2040. In its New Policies Scenario, over the period 2016-2040, cumulative subsidies to renewables are $4.7 trillion (equivalent to 0.2% of global gross domestic product over the same period). Of total cumulative subsidies, about three-quarters go to solar PV and wind power, about 20% to bioenergy and the remaining portion to other renewables-based power plants.
A feed-in tariff (FIT) obliges energy retailers to buy any electricity produced from specified (e.g. renewable) sources at a fixed price, usually over a fixed period of time (e.g. 20 years in Germany). FITs have been a key economic instrument used by governments to bring forward the deployment of renewables. The rates usually vary for different sources, but the price guaranteed is greater than that paid for power from traditional sources. There is usually no amount or proportion specified, though a cap or quota on how much needs to be bought overall, or from particular sources, may be applied. With renewables, any supply offered must be taken by the grid operator, regardless of merit order considerations (normally applying so that lowest marginal cost supplies are preferred). In Germany for instance, the grid operators buy the renewable kWh at the specified FIT rate and then sell them on the open market. The difference between the sales proceeds and the FIT they have paid to various suppliers is compensated by the end consumer through an 'EEG-surcharge' being applied to bills. Electricity-intensive industries have this surcharge limited.
FITs are common across much of Europe, Canada, China and Israel, and have been the dominant means of policy support for renewables in recent years. Despite their recent popularity, 2015 was the first year since 2000 that no new schemes were launched, and in some countries FITs have become unaffordable, and are being replaced with other mechanisms. A variation on FITs is the contract for difference (CfD), which means that if the market price is lower that the agreed 'strike price', the government or consumers pay that difference per kWh; if the market is above the strike price, the generator pays the difference to government or consumers. The key factor then is setting the strike price far enough ahead to enable investment. So while CfDs may raise the final cost of energy to the consumer, depending on prevailing wholesale prices,theyt also provide the energy producer with the guarantee of a known price for the electricity and reduces the risk created by volatility in wholesale energy markets.
A FIT/CfD that is sponsored by a government in order to decarbonize the energy system may inhibit market competition, but is nevertheless likely to be permissible by domestic laws, European law, and international free trade treaties, since these generally allow government intervention for the purposes of environmental protection.
A problem showing up in several countries, especially regarding FITs, is that they become increasingly costly to consumers as the take-up increases, and production costs decrease. In Germany, the cost of subsidies for solar power is expected to reach €46 billion by 2030. In Spain the initial take-up was so high that the government had to renege on its subsidy commitments after investments had been made. France cut back subsidies in 2010 and the UK has made multiple revisions to the FIT rates offered to new plants. Slovakia in 2011-12 slashed FITs for solar from 38 Euro cents/kWh to 11.9 c/kWh for small solar (up to 100 kW) in order to keep electricity prices down.
When governments change the FIT levels to adjust the incentive, the changes generally apply only to new sources.
Quota obligations are another form of direct subsidy used to provide support to renewables. The schemes require retailers to buy a certain (often increasing) proportion of the electricity they sell from renewable sources, or pay a penalty. Such schemes are a feature in the UK through the government's Renewable Obligation Certificate (ROC) scheme, in Australia through the Renewable Energy Target (RET) scheme, and in the USA through the Renewable Portfolio Standards (RPS).
Europe
In Europe FITs and preferential grid access have been widely used to shield renewables from market risks and incentivise investment. From 1 January 2017, however, EU member states are required to amend their subsidy schemes, in essence reverting to a competitive bidding process. The stated aim of the revised guidelines is to make support for renewable energy more cost-effective, thus reducing energy costs.
In the UK, renewable energy subsidies are paid for by consumers via energy bills through a number of government schemes, including the Renewables Obligation (RO) and FITs.
The RO came into effect in 2002 in England, Wales and Scotland, followed by Northern Ireland in 2005. The scheme obliges retailers to buy a stated proportion of the electricity they sell from renewable sources or to pay a penalty. It is the largest support mechanism in the UK for large-scale renewable electricity projects. The RO increased from 29% of supply for 2015-16 to 34.8% for 2016-17.
The scheme is facilitated via Renewable Obligation Certificates (ROCs). ROCs are tradeable commodities issued to operators of accredited renewable generating stations. ROCs have no fixed price – electricity suppliers and generators negotiate transfer prices. ROCs are used by suppliers to demonstrate that they have met their obligations. In the event that a supplier does not present a sufficient number of ROCs in a given reporting year, it must pay an equivalent amount into a buy-out fund. The fund is used to cover the scheme’s administration costs, with the balance returned to suppliers in proportion to the number of ROCs they produced relative to their individual obligation. In July 2011, the UK government announced that the RO scheme would close to all new generating capacity on 31 March 2017.
The UK government’s FIT scheme provides support for anyone investing in small-scale renewable technology, up to a maximum capacity of 5MW, or 2kW for CHP. Wind, solar, micro combined heat and power (CHP) and anaerobic digestion (AD) are all eligible for the support payments. Tariffs vary by supply source, and installation capacity, with payments made quarterly by the owner’s (or generator’s) energy supplier. Tariffs have decreased over time, and as part of its end-2015 review, the Office for Budget Responsibility (OBR) announced a series of cost control measures including deployment caps and a temporary pause on new applications.
The costs of renewable energy subsidies have risen materially for consumers, with the OBR projecting an over-allocation of renewable energy subsidies (subsidies are in principle capped at £7.6 billion in 2011/12 prices per year by 2020). The OBR released projected costs for RO and FITs in July 2015 (see below), which estimated that 2020/21 costs would reach £6.4bn (an average of about £20 per household), up from $3.5bn in 2014/15. The former Department of Energy & Climate Change (DECC) estimated that the cost of renewables subsidies for an average household would be £50 in 2017/18.
OBR subsidy cost projections
| |
2014/15 |
2015/16 |
2016/17 |
2017/18 |
2018/19 |
2019/20 |
2020/21 |
| RO |
2795 |
3360 |
4090 |
4475 |
4840 |
4840 |
4840 |
| FITs |
740 |
925 |
1095 |
1255 |
1375 |
1490 |
1600 |
2015 US$ millions
At the end of 2015, following a review by the OBR, the government announced a series of pre-emptive revisions to the RO scheme ahead of its closure, including early closure for both new solar capacity at 5MW or below and onshore wind from 1 April 2016. Electricity generation accredited under the RO would continue to receive its lifetime of support (20 years) until 2037 when the scheme ends.
In 2010 the newly elected government moved to replace the RO with contracts for dfference. Identifying the principal challenges facing the UK’s electricity sector – decarbonisation, security of supply and affordability – the government identified two key mechanisms to incentivise the required investment in energy infrastructure:
- Contracts for difference (CfDs) – guaranteed future prices for investors, reducing risk, and lowering the cost of capital (and therefore cost to consumers).
- The capacity market – a regular retainer payment to eligible forms of capacity, in exchange for such capacity being available when supply is tight.
CfDs are private contracts held between a low carbon electricity generator and the Low Carbon Contracts Company (LCCC), a government-owned entity. A given generator holding a CfD with the LCCC/government is paid the difference between the ‘strike price’ – a price for electricity reflecting the cost of investing in a particular low carbon technology – and the ‘reference price’ – a measure of the average market price for electricity in the UK market. If the reference price is above the strike price, the generator pays the difference to consumers through reduction in tariffs.
The capacity market commenced on 1 October 2016, aiming to secure future electricity supplies through supporting reliable capacity to meet demand during periods where demand was particularly high, or generation from intermittent sources particularly low. The scheme works by providing capacity providers with a steady payment to ensure supply remains sufficient. If providers supported via the scheme fail to deliver energy when needed, they face penalties. The capacity market is aimed to prevent early closure of existing non-renewable generation plant – as such, capacity receiving CfD support are not eligible to participate. The cost of the capacity market will be met by consumers via the supplier levy on electrical suppliers.
The UK also has a climate change levy (CCL), introduced in 2001. The CCL is a tax on UK business energy use, charged at the time of supply. Through to mid-2015, renewable energy sources were exempt from the tax, but the exemption has since been removed (with the government’s new policies detailed above superseding it). The UK government legislated to establish a carbon price floor/carbon price support from April 2013 to underpin the move to a low-carbon energy future. Per tonne of CO2, the floor price has risen from £4.94/tCO2 in 2013/14 to £18/tCO2 in 2015/16. At Budget 2016 the government stated that the maximum cap of £18t/tCO2 would be maintained and then uprated by inflation in 2020/21.
In Germany the Renewable Energy Sources Act (EEG) of 2000, revised in 2004, 2007, 2009, 2012 and 2014, governs subsidies. Germany applies a mixture of incentives for renewables, but until 2016 principally relied on wholesale FITs, which are guaranteed for up to 20 years.
Costs of the EEG are distributed among consumers via the EEG Surcharge. Under its latest iteration (EEG 2014), the EEG stipulates that grid connection of renewables has priority, but that the operator of the renewable plant has to bear the related costs.
The rapid expansion in supply of electricity from renewables has led to a significant rise in costs. The EEG Surcharge rose year-on-year to 2014, from just 0.19c/kWh in 2000 to 6.24c/kWh in 2014. As a result, the EEG has been reformed once more (EEG 2017), with its FITs being discarded in favour of a competitive auction system. The aim of the reform is to drive down prices for consumers, whilst bringing state law in line with new energy market liberalisation obligations set up by the European Commission. The subsidies are premiums on the wholesale price paid to operators on top of a monthly calculation of the spot wholesale price up to the bid price. Auction prices in August and June 2017 were €43/MWh for onshore wind, and €57/MWh for solar PV. For installations under 750 kW capacity (or 150 kW in the case of biomass), FITs, as stipulated in the EEG 2014 system, remain in place.
Germany in 2010 legislated for a tax of €145 per gram of uranium or plutonium fuel for six years, yielding €2.3 billion per year (about 1.6 c/kWh), a levy on nuclear generators of €300 million per year in 2011 and 2012, and €200 million 2013-16, to subsidise renewables, and a tax of €0.9 c/kWh for the same purpose after 2016.
In France renewable energy has been subsidised by FITs and tender systems since 2006. In 2016, the consumer contribution (CPSE) was set at €22.5/MWh, or about 16% of an average electricity bill.
Much like Germany, the French parliament has responded to the European Commission’s Environmental and Energy Aid Guidelines by creating a revised subsidy system. On 17 August 2015 the French enacted a new law on Energy Transition for Green Growth Act. In 2016, the FIT policy was replaced by a feed-in premium (FIP) scheme, essentially a CfD. Under the new FIP policy, producers will receive payments to cover the difference between the market spot price and former FIT price. In addition to the phasing out of FITs, the Act sets new targets for France’s carbon tax, with the aim that it will increase to €46 by 2020, and €100 by 2030.
In addition, the French parliament’s capacity market started in 2016, originally introduced by the 2010 NOME Act.
In the Netherlands, after announcing a one-third increase in subsidies for solar, wind, geothermal and other renewables projects to €12 billion in 2017, from €9 billion in 2016, the government announced progressive phasing out of renewables subsidies from about 2016. The country will also invest some €20 billion in the development of a smarter and more capable grid which is suited for intensive electric vehicle charging by 2035.
Denmark has a wide range of incentives for renewables and particularly wind energy, which alone account for around 42% of the country’s energy requirements. Incentives are financed through so-called public service obligations (PSOs), accounting for one-third of wholesale electricity prices. Further costs are borne by power utilities and customers – when there is a drop in wind, back-up power is bought from the Nordic power pool at the going rate, and similarly, any surplus (subsidised) wind power is sold to the pool. Official estimates of the net effect of this is put expected losses at DKr 1.5 billion per year.
Sweden subsidises renewables (principally large-scale hydro) by a tax on nuclear capacity, which works out currently at about €0.75 cents/kWh (making up about one-third of the operating costs for nuclear plants). After a cross-party consensus was reached in June 2016, it was agreed that the controversial tax would be phased out by 2019. The country also provides operating subsidies for renewable sources via a certificate system, similar to the UK’s ROCs.
Sweden provides further support to wind power investors by allowing faster-than-actual-rate depreciation of windmills for income tax purposes.
Italy had a quota (Renewable Portfolio Standard) and tradable certificate scheme with an average price of 12.53 c/kWh for renewables excluding solar PV, or 17.27c/kWh including solar PV, in 2006. This was replaced by FITs, but due to the proliferation of solar PV capacity, the cost reached €3.8 billion in 2011, and the €6.7 billion cap on subsidies for 2013 was reached midway through the year, with almost 18 GWe installed. At that time, FITs were 10.6 to 18.2 c/kWh, depending on size and location. Innovative plants got 21.7 to 24.2 c/kWh, whilst concentrating solar PV got 17.4 to 21.5 c/kWh, guaranteed for 20 years. The government decided on a FIT reduction of 17-25% in 2014, and announced in January 2015 that it would cease subsidies to solar plants.
Switzerland in 2015 cut solar PV subsidies twice, by 7% and then 14%. Early in 2015 the waiting list for PV subsidies amounted to 37,263, equal to a total subsidy demand of CHF 415.6 million.
In Norway the government subsidises wind energy with a 25% investment grant and then production support per kWh, the total coming to NOK 0.12/kWh, against a spot price of around NOK 0.18/kWh (US 1.3 c/kWh & 2 c/kWh, respectively).
Spain has had a FIT of €7.32 c/kWh for wind energy, 27 c/kWh for solar thermal, and 31-34 c/kWh for solar PV. In 2010 cuts of 25% for roof-mounted solar systems and 45% for larger ones were announced. In February 2013 subsidies were cut further and indexed to an inflation estimate that strips out the effects of energy, food commodities, and tax changes. In 2000, the government had promised more than 20 years of large subsidies, and investment had proceeded on this basis.
At the end of 2012 Spain brought in higher taxes on power generation to address a €24 billion energy tariff deficit after more than a decade of selling electricity at regulated rates which did not cover costs, with some €7 billion per year subsidies on renewables. The cost of subsidies was not passed onto consumers, since this would have made power unaffordable. However, foreign investors put a lot of money into wind and solar projects due to the high FiTs – some €13 billion. But this power generation tax, plus subsidy reductions in 2010 and further major cuts in February 2013, meant that the government had reneged on the terms of that investment, and legal action under the international Energy Charter Treaty was planned.
In July 2013 the Ministry of Industry, Energy and Tourism introduced further ‘definitive reforms’ to reduce the deficit by €4.5 billion per year. These measures remove the FIT system and substitute it for a new regulated asset value-based system. The new system will cut the payments for renewables by €1.3 to 1.4 billion per year. Overall they will cost utilities €2.7 billion per year. Solar companies are expected to be worst affected, due to debt load estimated at €30 billion, and widespread financial distress is predicted by solar and wind industry groups. In May 2013 renewables received an average subsidy of €100/MWh.
Spain has taxes on nuclear power (apart from company tax) which amount to about half of operating expenditure. The main taxes are irradiated fuel tax, ENRESA levy, and Energy tax – together amounting to about €18/MWh. With low wholesale prices, this compromises economic viability.
Greece has a FIT of 6.1-7.5 c/kWh, whereas the Netherlands relies on exemption from energy taxes to encourage renewables.
The Czech Republic had a mandated FIT for solar power of CZK 12 ($0.63) per kWh, about ten times the cost of power generated by CEZ. This was threatening grid stability and was reduced to CZK 5.5 for new PV projects over 100 kW and CZK 7.5 for smaller ones after the end of 2010. However, the impact of some 1600 MWe constructed by then was expected to lead to an increase in electricity prices of 13% for residential and 18% for industry consumers in 2011, and a 25-28% retroactive tax on solar electricity from installations over 30 kW was introduced, but was challenged. The International Photovoltaic Investors Club (IPVIC) had an arbitration complaint being lodged in the first quarter of 2013 with findings expected in 2014. The investors group was reportedly seeking up to CZK 2.5 billion in damages.
From January 2014 the Czech government ended all support for new renewables capacity coming online from then, and set a CZK 495/MWh (€19/MWh) cap on payments by consumers for renewable power – a 15% drop from 2013. The level of direct government payments to cover the costs of FITs and green bonus scheme payments for electricity from renewables rose to an estimated CZK 15.7 billion (€600 million) in 2014. Total Czech support for renewables was estimated at CZK 44.4 billion (€1.7 billion) in 2013.
Slovakia has drastically cut back on subsidies for solar power, after a boom in response to generous FITs pushed the household price of electricity up by 5%. Only roof-mounted PV panels under 100 kW will now be eligible. The subsidy cost jumped from €10 million in 2010 to €117 million in 2011 (to 30 June). The planned 8 MWe of new solar capacity to the end of 2010 ended up with 145 MWe total, and 115 MWe more was expected by the end of June 2011 cut-off.
Latvia has FITs of 9.6 to 18.2 Euro c/kWh for wind, depending on size of generator, and 42.7 c/kWh for solar PV. Lithuania's feed-in tariff for wind is 8.7 c/kWh. Elsewhere in the EU, small-scale PV input is encouraged by high FITs, e.g. 50 c/kWh in Portugal.
Serbia published new FITs early in 2013, which will be valid for 12 years from project commissioning and will be corrected annually, every February, in line with the level of inflation in the Eurozone. They include 9.2 Euro c/kWh for wind and 16.25 c/kWh for solar, but with low caps on the capacity covered.
Turkey, under its December 2010 Renewable Energy law, has a basic FIT of 7.3 c/kWh. This can then be increased by up to 3.7c for wind, up to 9.2c for concentrating solar thermal, and up to 6.7c for solar PV, depending on the equipment used and its local content. Prior to this, the FIT was € 5.5 c/kWh.
North America
The US government spent $24 billion on energy subsidies in 2011, $16 billion of this for renewables including $6 billion for ethanol tax credits, according to the Congressional Budget Office. The production tax credit for wind cost $1.6 billion. Fossil fuels got $2.5 billion in tax breaks.
According to Subsidy Tracker based in Washington, the total value of subsidies to the biggest players in the US wind industry to 2016 (most from 2007) was $176 billion.
In the USA a direct subsidy or production tax credit (PTC) has been made available to generators of renewable power over the first ten years of a project's operation so they can sell it at much below actual cost. The subsidy is granted as credit on taxes, though following the American Recovery & Reinvestment Act (ARRA) in mid-2009, an investment tax credit (ITC) of 30% could be claimed instead for wind plant placed in service before 2013 if construction began before the end of 2013. A total of $16.8 billion had been provided in direct grants for energy efficiency and renewable energy projects under ARRA. This credit can be converted to a grant from the government. The cost is borne by taxpayers rather than electricity consumers.
The PTC is indexed to inflation, and was extended each year to the end of 2013. With a wholesale electricity price of around 2.8 c/kWh, the PTC meant that intermittent wind generators could dump power on the market to the extent of depressing the wholesale price so that other generators were operating at a loss. This market distortion has created major problems for the viability of dispatchable generation sources upon which the market depends. In December 2015 a new spending package included a retroactive five-year extension on the PTC for wind and the ITC for solar. The PTC gives wind developers not claiming the ITC a credit of 2.3 c/kWh for electricity supplied to the grid, and this amounted to over $5 billion in 2016 for 226 TWh from wind. Projects that commenced construction in 2015 or 2016 will receive the full value PTC. The level will reduce to 80% for those commencing in 2017; 60% PTC in 2018; and 40% PTC in 2019.
Several US states and municipalities have introduced FITs to incentivise investment in renewables. Vermont enacted one in 2009 and Gainesville, Florida had one until 2014 in the 26-32 c/kWh range. California and some other states have a renewable portfolio standard (RPS), mandating a specified amount of rewewable power from suppliers, with the cost borne by consumers. As of February 2017, 29 US states operated an RPS. California's policy, for example, requires all electricity retailers to procure 20% of retail sales from renewables by the end of 2013; 25% by the end of 2016; and 33% by the end of 2020.
The USA offers a production tax credit of 1.8 c/kWh from the first 6000 MWe of new-generation nuclear plants in the first eight years of operation. Unlike the renewables PTC, the nuclear credit is not inflation adjusted.
A recent study by Management Information Services found that between 1950 and 2016, 40% of all federal energy incentives were directed towards the oil industry, 16% to renewables, and 8% to nuclear.
Summary of Federal Energy Incentives During 1950-2016 (million $)
| Incentive type |
Energy source |
Summary |
| |
Oil |
Natural gas |
Coal |
Hydro |
Nuclear |
Renewables |
Geothermal |
Total |
Share |
| Tax policy |
218 |
122 |
40 |
14 |
- |
84 |
2 |
479 |
47% |
| Regulation |
138 |
5 |
11 |
6 |
18 |
1 |
- |
179 |
18% |
| R&D |
9 |
8 |
43 |
2 |
85 |
32 |
6 |
185 |
18% |
| Market activity |
8 |
3 |
3 |
78 |
- |
4 |
2 |
98 |
10% |
| Gov't services |
38 |
2 |
19 |
2 |
2 |
3 |
- |
66 |
6% |
| Disbursements |
3 |
- |
-4 |
3 |
-27 |
34 |
1 |
10 |
1% |
| Total |
414 |
140 |
112 |
105 |
78 |
158 |
11 |
1018 |
|
| Share |
40% |
14% |
11% |
10% |
8% |
16% |
1% |
|
100% |
Renewables include wind, solar, and biomass, primarily.
In Canada there are no FITs or quota obligations at the federal level, but they are implemented in some provinces. In Ontario, under a 2009 Green Energy Act, FITs were introduced, ranging from 11 c/kWh for landfill gas and 13 c/kWh for wind to 80.2 c/kWh for solar PV
East Asia
In Japan since 2009 a FIT required utilities to buy surplus solar power produced domestically at up to JPY 48/kWh. This was extended to hydro, wind and geothermal power at JPY 17-20/kWh, compared with JPY 5-7 for base-load power. In mid-2012 the general FIT was increased to JPY 42 /kWh for solar-generated electricity, double the tariff offered in Germany and more than three times that paid in China. The level was reduced in April 2014 to JPY 37/kWh residential and JPY 32/kWh for systems over 10 kW. Wind power FIT was JPY 22 /kWh for onshore units above 20 kW, JPY 36 for offshore wind and JPY 55 for smaller units.
In China the Global Wind Energy Council acknowledges "the fact that wind is heavily subsidised". This is under a variety of complex measures focused on capacity rather than output, and correlates with a low average capacity factor of 16% over 2006-07, partly due to grid constraints. China's 2006 Renewable Energy Law sets out a subsidized electricity tariff structure (though no FIT), a compulsory grid connection mandate for renewable energy projects, and a rule that requires utilities to purchase all the renewable electricity produced in their service area. In addition, carbon credits awarded under the UN Clean Development Mechanism (CDM) enable foreign investors in Chinese wind projects to sell carbon credits outside the country, this being essential to project viability. From 2016 the National Development and Reform Commission (NDRC) cut wind tariffs by CNY 0.02 to 0.03 /kWh.
Solar power has enjoyed substantial incentives in China since 2009, and in 2011 the national FIT was CNY 1.15 per kWh (18 US cents), but in 2012 this was reduced to CNY 0.55 (8.7 US cents). From 2016 the NDRC cut solar tariffs by CNY 0.02 /kWh (and more inland). Late in 2012 subsidies for solar power were boosted by CNY 7 billion ($1.1 billion) to a total of CNY 13 billion. The subsidies are to allow support of 5.2 GWe of domestic solar energy production.
Australasia
Australia's Mandatory Renewable Energy Target (RET or MRET) has since 2001 required retailers each to buy a certain proportion of the electricity they supply from non-hydro renewable sources at whatever price they can, or incur a penalty by paying a shortfall charge. The original 10% target or 9500 GWh by 2010 was increased in 2009 to 20% by 2020, then in 2015 the Large-scale Renewable Energy Target (LRET) went to 23.5% or 33,000 GWh, representing a major increase from non-hydro sources. The shortfall charge went from AUD 4 cents to 6.5 c/kWh, and has been running at over 8 c/kWh for some time. The obligation is tradeable. The cost is borne by consumers.
In 2013-14 subsidies were estimated at 4.2 c/kWh for wind and 41 c/kWh for solar, the latter being both for RET and FITs to householders. The total for renewables that year was A$2.8 billion. It was estimated that the RET added about 3% to the typical household or small business electricity bill, and almost 9% for large business (over 5 GWh/yr), and state-based FITs add significantly to this.
Government-commissioned modelling suggested that the net overall power cost to consumers would be 0.5 c/kWh to 2015 and then 0.77 c/kWh to 2020. A 2011 study by Carbon Market Economics found that each tonne of CO2 emissions eliminated through the use of renewable energy plants commissioned by the end of 2010 cost $76 in subsidies.
FITs are on a state basis. Those Victorian and NSW householders who were first to set up solar PV behind the meter sell power to the grid at 60 c/kWh, compared with about 8 c/kWh for coal-fired power delivered to the city. More recent connections have a FIT of 5 c/kWh.
Indirect subsidies
Some fuel types benefit from indirect subsidies by virtue of their ability to legally discharge waste products into the environment. Fossil fuels receive indirect subsidies, which may be quantified as external costs – see information paper on Externalities of Electricity Generation.
General Sources
OECD International Energy Agency R&D Database
Renewable energy policy in IEA countries, Volume II: Country Reports, OECD International Energy Agency (1998)
Reforming Energy Subsidies, United Nations Environment Programme (UNEP) Division of Technology, Industry and Economics & International Energy Agency (2002)
Energy Policies of IEA countries: 2003 Review, OECD International Energy Agency (2003)
World Energy Outlook, OECD International Energy Agency (annual)
Health and Environment in Sustainable Development: Five Years after the Earth Summit, World Health Organization (1997)
Global Wind Energy Council, Global Wind Reports
Reiche D. & Bechberger M., Policy differences in the promotion of renewable energies in the EU member states, Energy Policy, 32, 7: 843-849 (2004)
Eurelectric, A Quantitative Assessment of Direct Support Schemes for Renewables (2004)
House of Lords Science & Technology Committee, Renewable Energy: Practicalities (2004)
Energy subsidies in the European Union: A brief overview, European Environment Agency (2004)
Bezdek, Roger H. & Robert M. Wendling, Real Numbers: The U.S. Energy Subsidy Scorecard, Issues in Science and Technology 22, no. 3 (2006)
European Renewable Energies Federation, Prices for Renewable Energies in Europe: Feed in tariffs versus Quota Systems – a comparison, Report 2006/2007
Analysis of Federal Expenditures for Energy Development, Management Information Services, Inc., prepared for the Nuclear Energy Institute (2008)
Williams, J.H. and Kahrl, F, 2008, Electricity reform and sustainable development in China, Environmental Research Letters, 3, 4 (2008)
US National Research Council, Hidden Costs of Energy: Unpriced Consequences of Energy Production and Use (2010)
Australian Government Productivity Commission, Carbon Emission Policies in Key Economies, Research Report (2011)
US Energy Information Administration, Direct Federal Financial Interventions and Subsidies in Energy in Fiscal Year 2010 (2011)
Boisvert, Will, Green Energy Bust in Germany, Dissent Magazine (2013)
Principal Economics, Electricity Production Subsidies in Australia (2015)